Fundamental analysis is one of the most important approaches in studying the market and making decisions. It is often broader than other forms of analysis, which includes technical and sentimental analysis.
In this article, we will look at what fundamental analysis is and how to do it well.
Table of Contents
What is fundamental analysis?
Fundamental analysis is defined as a method of analysing financial assets like stocks, commodities, forex, bonds, and cryptocurrencies to determine whether a financial asset is a buy or a sell.
It looks at the intrinsic issues of a company that have an impact on their valuation. It also looks at the most recent news and data and how they impact these financial assets.
The goal of fundamental analysis is to find out whether an asset is undervalued or overvalued. It also seeks to establish the key news that will move the assets.
A good example of this is when the Federal Reserve delivers its interest rate decision. When this happens, it usually affects the price of most assets like crypto and stocks.
Who benefits most?
Fundamental analysis is a useful process used by all types of traders. However, it is usually more useful for swing and long-term traders. In most times, scalpers rarely use it because they are usually not interested in the main numbers.
On the other hand, ordinary day traders use fundamental analysis when planning their trading strategies.
For example, day traders who rely on volatility tend to use fundamental data to predict when movements will be higher. That’s because, the market is usually more volatile when key numbers are released.
Fundamental vs technical analysis
Fundamental and technical analysis are different from one another. While fundamental analysis refers to the study of economic and financial data, technical analysis is the use of technical tools to help you determine entry and exit levels.
In most cases, technical analysis is used by day traders and scalpers while fundamental analysis is mostly used by long-term and swing traders.
This is simply the process of using technical indicators like moving averages, relative strength index (RSI), and the awesome oscillator to determine entry and exit points.
The Federal Reserve and fundamental analysis
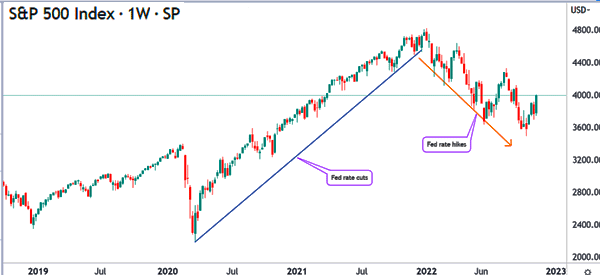
In our experience, we believe that the Federal Reserve is the most important part of fundamental analysis. A good example of this is shown in the chart below.
The chart shows that the S&P 500 index surged between March 2020 and early 2022. This trend coincided with a period when the Federal Reserve slashed interest rates and implemented its biggest quantitative easing (QE) policy.
The index then started dropping in 2022 as the Fed delivered numerous giant interest rate hikes.

The Fed is so important in that it affects all financial assets around the world. This happens because of the special role of the US as the biggest economy in the world and the US dollar as the world’s reserve currency.
Therefore, broadly, any fundamental analysis needs to begin with the Federal Reserve. As such, you should look at the key factors that move the Federal Reserve. Let’s see some of the top economic numbers to watch that move this institution.
Inflation data
Inflation is an important part of the economy. It simply refers to the upward move of prices of items. In fact, inflation is one of the dual-purpose of the Federal Reserve. It was formed in a bid to ensure that inflation remains stable.
In most cases, the Fed hikes interest rates when it believes that inflation is getting out of hand. It then slashes rate hikes when it hopes that inflation has been maintained. Therefore, traders look at three important inflation numbers, including:
- Consumer price index (CPI) – This figure looks at the broad change of prices of items. It is published on a monthly basis.
- Producer price index (PPI) – This number looks at the change in prices of items that producers pay for. It tends to have an impact on the cost of items that people buy.
- Personal Consumption Expenditure Index (PCE) – This is the Fed’s favorite inflation tool, and it measures consumer spending.
Related » 10+ Economics Data You Should Look for
Employment
The other dual-role of the Federal Reserve is to ensure that the economy has a low unemployment number. In the US, the government publishes key employment numbers every month. In most periods, these numbers come every first Friday of the month.
Therefore, traders look at these numbers to determine whether the Fed will hike or slash interest rates. When inflation remains stubbornly high and the unemployment rate low, it increases the possibility that the Fed will hike interest rates.
There are other economic numbers that investors and traders watch in fundamental analysis, included:
- PMIs – These numbers are published every month to show the performance of key sectors of the economy. They include services and manufacturing data.
- Retail sales – These numbers show the volume of retail sales that people bought in the US every month.
- Consumer confidence – These numbers are important because consumer spending is the biggest part of the American economy.
- Production – The data shows things like industrial and manufacturing production that show the volume of production.
This fundamental analysis can help you determine wether to buy or sell financial assets, including stocks, currencies, and indices.
Other Economic Data
Non-farm payrolls data show the number of people different sectors of the economy are adding or reducing. Investors and traders use this data to know whether to invest in the country or stay away.
Another example of economic data are Company’s earnings or the crude oil inventories. These inventories show crude oil investors the trends that are going on in the oil market and how to invest, going forward.
As a trader, it is therefore very important to understand the different types of economic and company data, when they are released, their relevance, and how to trade when they are released.
Fundamental analysis in stocks
It is also possible to do fundamental analysis in stocks. This includes looking at several key factors that move stocks. Some of the top fundamental things to look at when trading and investing in stocks are:
- Earnings – This is where you look at a company’s earnings and determine whether to invest or trade it. You can use the economic calendar to know companies that are about to publish their financial results.
- Valuation – You should look at stocks valuation. This is where you use various valuation metrics to know whether a stock is overvalued or undervalued. You can use multiple comparison and DCF valuation metrics.
- Company news – Another fundamental thing to consider is the latest company-specific news. These news include management change, merger and acquisition, and an investigation.
In addition to all this, you can use key tools provided by most brokers to conduct stock analysis in stocks. Some of these features are Level 2 and Time & Sales.
Level 2 provides the exact bid and ask prices of stocks. Time & sales considers the exact time and volume of stocks. You can use this data to determine whether to buy and or short a stock.
Fundamental analysis in cryptocurrencies
It is also possible to do fundamental analysis in the crypto industry. This should start with a broader view of the market, which starts with the macro view. The macro view should involve things such as the Federal Reserve and other factors.
Beneath that, you can also do an on-chain analysis, where you look at key trends in the specific crypto. There are several on-chain metrics that you can look at when analysing cryptocurrencies.
Some of the top metrics to consider are the number of users, exchange inflows and outflows, in-the-money and out-of-money, transactions volume, exchange reserve, and network value to transaction.
Related » Analyze Fundamentals in Forex
Combining technical and fundamental analysis
A key rule that many day traders use is that they combine fundamental and technical analysis. This is where they use the two together in a deal to predict the next price action. Technical analysis is where a trader looks at charts and determines the next price action.
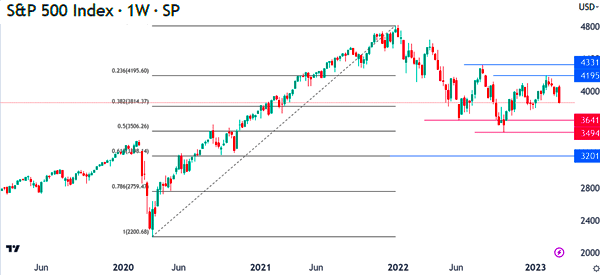
A good example of this is shown below. In this chart, we can use fundamental analysis to focus on things like earnings and the Federal Reserve.
If you believe that the Fed will continue hiking rates, then you can use technical analysis to find the key levels to watch, including $3,641 and $3,494. For this trade, the stop-loss will be at $4,195 and $4,331.

Create a plan
To master the art and science of fundamental analysis, you must have a plan! This plan will help you know how to trade when the data is released.
Some traders love to be on the sidelines when the data is released. They do this for the simple reason that they cannot predict accurately the data that will be released.
On the other hand, there are traders who like trading when the data is being released. They do this because of the volatility that is usually happens after the release of the data.
The best thing for you to do is to create a plan and know how you will be trading in this.
We have adopted a very simple way of trading when the economic or earnings data is released. We always stay out of the market two hours before the data is released. Then, we enter certain assets 30 minutes after the data has been released.
At that time, we can confidently predict the direction the asset will go.
The key to success in fundamental analysis is experience. In this, the more time you take to study and analyze the market behavior after the data is released the better it is for you.
Related » The pitfalls of information overload
Economic and Earnings Calendar
The earnings and economic calendars are two influential items that investors and traders use. For you to be successful in this type of analysis, you must first know the time when different data is released.
The two calendars can help you know when to expect the data to be released. As a trader, We recommend that you visit the economic calendar at the end of the week. This will help you plan your trading for the following week.
Related » Wise Traders Should Believe in Analysis, not Forecasting
Best sources of fundamental data
As a day trader who uses fundamental analysis, you will need to have a good access to fundamental data. Fortunately, there are many sources of this information, including:
- Investing.com – Investing is a well-known website that provides all types of fundamental data such as economic, financial, IPO, and stock split calendars.
- SeekingAlpha (SA) – SA is a major publisher of financial content from thousands of authors from around the world. It also provides other important tools like instant news and calendars.
- Bloomberg, CNBC, WSJ, and FT – These are the biggest vendors of financial information. As a trader, you should make a point of checking them out every day.
- Barchart.com – Barchart is an excellent website that provides you with access to quality analysis tools.
Another good solution is to watch TraderTv Live on Youtube!
Final thoughts
Fundamental analysis is one of the three types of analysis in financial trading. The others are technical analysis and sentimental analysis. Having a good understanding of the strategy will help you become a better day and swing trader.
To master this analysis you need three things:
- Know when the relevant data will come out
- Learn how to interpret the data
- How to trade using the data soon after and before it is released
Also, remember that the way you trade will not always work. You should learn how to adopt to that too.
And you? Do you prefer fundamental or technical analysis? Do you have other methodologies to propose? Let us know in the comments!
External Useful Links
- Fundamental Analysis: Overview and Components – CorporateFinaceInstitute
- The Role of Fundamental Information for Trading Strategies [PDF] – Science Direct


