

Everybody knows it: hindsight is 20/20.
When you look at a stock’s price chart, you can spot the exact moments when you could have taken the biggest profit. If only you could be certain about the next movement before it happens—and not only after.
Inexperienced traders can lose a lot of sleep trying to figure out the puzzle of when the best time frame to trade is. They study technical indicators and practice charting techniques to spot the next breakout before anyone else.
Professional traders know better than to worry too much about price movement—instead, they focus mainly on positioning for a profitable trade and minimizing losses. They also know that using different trading time frames to analyze an asset makes all the difference in the world.
The difference between viewing an asset on a 1-minute or a 1-week time frame is night and day—the best time frame is the one best suited to your trading strategy.
In this article, we’ll detail what trading time frames are, and take a look at which work best with each of the dominant day trading strategies.
The Three Approaches: Swing Trading, Day Trading, and Scalping
First, we need to understand the basics.
Under the category of trading styles , there are three dominant approaches with different lengths of position holding. Knowing these differences will make it easier to figure out which trading time frames work best for you.
Swing Trading
With their trades measured in multiple days to weeks, swing traders play the longest game of all. They don’t mind holding an asset overnight and rarely look at any time frame shorter than 4 hours. They like to spot trends in a daily time frame.
Swing traders use technical and fundamental analyses to evaluate assets and imagine impending price movement. They watch the news and need a thick skin when it comes to enduring overnight changes in price.
To manage risk, swing traders keep a close eye on their total portfolio exposure, and they make sure not to get sucked into emotional trading as prices “swing.”
Day Trading
The golden rule in day trading is that you close all your positions by the end of the day. Day traders usually look at hourly trading time frames and use the 4-hour time frame to hunt for trends. They execute multiple trades a day and prefer volatile stocks with lots of intra-day movements.
How do day traders choose the best time frame to trade? They rely on a mix of technical analysis, chart patterns, and the 24-hour news cycle to plan their trades. Risk management for day traders typically includes stop-loss orders and careful position sizing to limit daily drawdown.
Scalping
A scalper has to be the most attentive and quick-moving of all the traders. Scalpers rarely hold an asset longer than a few hours and like to use ultra-short trading time frames, such as 1-minute, 5-minute, and 15-minute.
Scalpers may execute hundreds of trades in a single day, relying on chart patterns, technical indicators and market-depth analysis to guide their actions. They use aggressive stop-loss orders and quick exits—win or lose, scalpers don’t dilly-dally.
What Are Trading Time Frames?
Traders live and breathe by the information they gather from their trading platform. Although there are many different ways to view an asset and its price action, trading time frames (or time-based candlestick charts) offer some of the most useful information.
Candlesticks are a popular chart graphic that shows the high, opening, closing, and low prices of an asset. Time frames are exactly that, during a specific interval of time.
The most common trading time frames include:
- 1 minute (M1) chart.
- 5 minute (M5) chart.
- 15 minute (M15) chart.
- 30 minute (M30) chart.
- 1 hour (H1) chart.
- 4 hour (H4) chart.
- Daily (D1) chart.
- Weekly (W1) chart.
- Monthly (MN) chart.
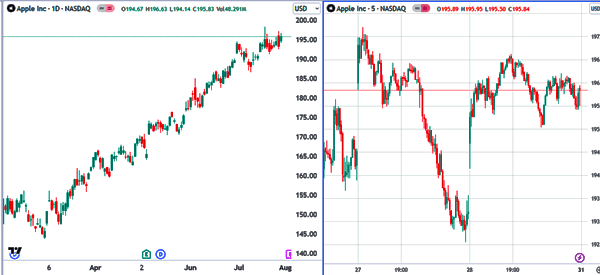
In the chart below, you can see an example of two trading time frames and how different they present the asset’s price action.
In this case, it’s Apple stock (NASDAQ: AAPL) , and you can see that the daily (D1) chart on the left shows a steady upward (bullish) trend across multiple months. Alternatively, if you zoom in on a 5 minute (M5) chart, the stock is moving sideways—with minimal opportunity for a scalper.
Professional traders use time frames to help:
- Identify and confirm trends.
- Align strategy.
- Manage risk.
Above all, smart traders use multiple time frames to help separate the signal from the noise in an asset’s price movement. As you can see in the Apple example above, if you zoom in too close, you might miss bigger opportunities. Inversely, if you only look at the big picture, you could overlook the small but significant volatility that scalpers live for.
Smart Traders Take the Time to Learn
Imagine the pressure to get a scalping trade right when every second matters. Or picture the disappointment of misinterpreting a candlestick graph and fumbling the trade. While mistakes are part of any learning process, this is no place for mistakes.
If you don’t have your stop-orders set up right, or miss your ideal trading window, you will lose a lot of precious capital.
Education and practice are key to becoming professional trainers who don’t blink when the adrenaline kicks in. At Real Trading, we’ve developed a structured learning platform where novices and experts alike are taught how to study price action, master risk management, and execute trades with discipline.
With training, you don’t guess the best time frame to trade. It’s just calm, disciplined execution– whether scalping minutes, hours or the day.
Our coaches teach and mentor every trader to respect the clock, but never to fear it. They help you train and practice, risk-free on our TMS™ simulator, so that mistakes become lessons, not losses.
The markets reward traders who are smart and prepared–you will be both with our training program.
Now, let’s get back to which trading time frame is right for you.
The Best Time Frames for Each Trading Approach
We recommend that every trader consider a given trade from multiple angles.
By concentrating solely on one method of evaluation or neglecting the diversity of trading time frames, you risk missing critical insights and experiencing unnecessary losses.
On that note, the shorter your trading time frames are, the more essential it is that you have direct market access. If your trades are delayed by a few seconds, the results could be disastrous.
Depending on the trading approach, you will have to use different trading time frames.
Time Frames for Scalpers
- 1 minute (M1) chart: this is the most granular view of price movement and it’s the one that every scalper should be tracking.
- 5 minute (M5) chart: useful for picking out short-term trends, this time frame offers a better signal-to-noise ratio than the M1.
- 15 minute (M15) chart: although some scalpers might look at the M30 chart, the M15 offers a helpful overview while maintaining the granularity that scalpers rely on.
Time Frames for Day Traders
- 5 minute (M5) chart: offers good granularity without creating too much noise for day traders. The M5 plays a big role in identifying trends as well as entry and exit points.
- 15 minute (M15) chart: here’s where day traders begin to see broader market trends develop, especially when used to confirm early signals that first appear in the M5.
- 30 minute (M30) chart: M30 is critical for planning trades that might last hours. It gives a high-level view of support and resistance levels that day traders need to watch.
- 1 hour (H1) chart: the H1 helps day traders look at intraday price movement and spot larger trends that can even spill over into the next day.
Time Frames for Swing Traders
- 4 hour (H4) chart: this is about as short a time frame swing traders can make use of. It’s good for looking at intraday movement and can help with entry/exit decisions.
- Daily (D1) chart: the D1 chart allows traders to keep an eye on the large swings that can happen overnight. It’s good for picking up early signals on broader trends.
- Weekly (W1) chart: W1 is helpful for identifying support and resistance levels that are more significant than the intraday movement.
- Monthly (MN) chart: this is the broadest scope that short-term traders use. It offers a good balance to the comparative granularity of the H4 and D1 charts for swing traders. Longer than this, and we’re already talking about long-term investing.
As you can see, different trading time frames serve different purposes, but it’s important to consider all of them. Don’t be afraid to take a look at time frames that you wouldn’t usually use to trade—you can always get information to enlighten your moves.
Using Multi-Timeframe Analysis to Your Advantage
Time frames in trading are similar to using a telescope to look at the moon. The closer you focus, the more detail you can see. One time frame isn’t more valuable or accurate than another—the aggregation of prices creates a picture that is conducive to certain strategies.
Beware: focusing blindly on a single time frame can create a false sense of certainty and lead you to misread the data.
That’s where multi-timeframe analysis (MTFA) comes into play. Within MTFA, there is a popular concept known as the rule of three. Experienced traders usually analyze a stock at the widest of three time frames, moving to successively shorter time frames before placing a trading order.
For example, imagine that you’re a swing trader considering a trade on a stock that you’re unfamiliar with. You start by looking at the W1 time frame and applying a few of your trusted technical indicators to look for strong signals. Then, you move to the D1 chart and run the same analysis. You wrap up your assessment with H4 before making a final decision.
MTFA will help you identify primary or long-term trends, intermediate or medium trends, and immediate (short-term) price action. Once you’ve layered on support and resistance levels for the various time periods, you’ll have a much stronger sense of how to plan your entry and exit points.
A Real-World Example of MTFA
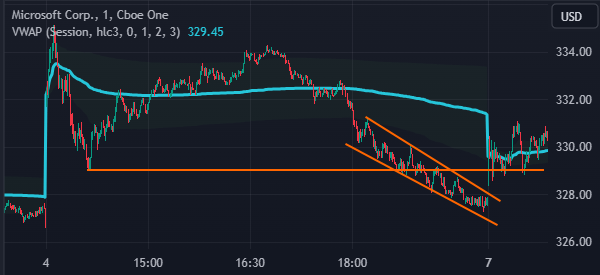
In the 1 minute chart below, you can see that Microsoft (NASDAQ: MSFT) shares were in a strong bearish trend. It moved below the VWAP and the important resistance level at $329. It also formed a falling wedge pattern, pointing to a bullish reversal when the wedge nears the confluence level.
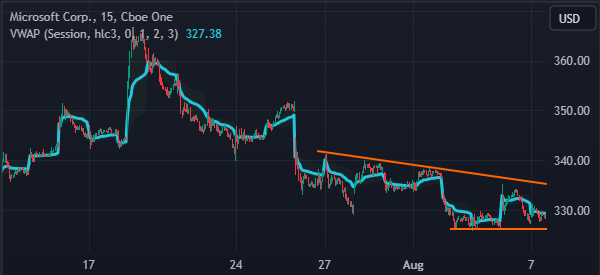
In the 15-minute chart, you can see that the Microsoft stock price dropped below the VWAP indicator. The stock is nearing the important support level at $326. Therefore, in this case, a trader might place a bearish trade, with the take-profit order set at $326.18.
It’s good to adopt a regular practice of MTFA for every trade you conduct. It’s not a fool-proof way to avoid bad trades, but it’s like checking your car mirrors before you change lanes—it’s the cheapest protection you can get.
It’s Time for You To Make a Real Profit
Using trading time frames successfully in day trading isn’t something you do overnight (pun unintended). It’s one of many tools that professional traders study and integrate into every trade. The more you practice it, the faster it becomes part of your strategy, revealing opportunities and flagging situations you should avoid.
Our TMS™ simulator lets you practice risk-free, while our coaches guide you in:
- Learning from your mistakes.
- Optimizing entries/exits for your chosen time frame.
- Prioritizing skills over emotions—the hallmark of a pro.
Don’t waste time trying to learn it on your own or guessing when the best time to trade is. At Real Trading, we teach you how to trade smarter, faster, and easier.

