

The labor market is an essential leading indicator followed by investors, traders, and policymakers. It is important because it can lead to a change of both fiscal and monetary policy. In the United States and other countries, the labor market forms the dual mandate of the central bank.
Most countries publish their jobs numbers every month to provide policymakers and other participants more information about the state of the economy.
In this article, we focus on the US non-farm payrolls (NFP) report that comes out every first Friday of the month.
Table of Contents
What is the US non-farm payrolls (NFP) or jobs day?
The US jobs day refers to the day when the Bureau of Labor Statistics (BLS) publishes the country’s jobs data for the previous month. In most cases, the jobs data comes on the first Friday of the month.
In some cases the jobs report can be delayed slightly. For example, when there is a major public holiday on a Friday, the BLS can decide to publish the jobs report the following Friday or a day before. Also, the BLS may decide to release the data the following Friday.
The jobs report is made up of several parts, including:
- The non-farm payrolls numbers
- Unemployment rate
- Participation rate
- Sectoral job
Sectoral is where it looks at the number of job additions or reduction by sector.
Related » The importance of Economic Data for Traders
Key Jobs Numbers Report Data to look for
Wage Growth
First, they look at wage growth. Wage growth is an important part of the labor market because of its impact on inflation and consumer spending.
A key assumption among economists is that low unemployment rate leads to higher wages. At the same time, higher salaries lead to more consumer spending, which then pushes inflation higher.
Inflation forms the other part of Fed’s dual mandate. Therefore, if wage growth is growing at a faster pace, expectations are that the Federal Reserve will either start hiking rates or accelerate its tightening.
Since workers are paid per hour, an increase in the hours is an indication that they are making more money. As a result, consumer spending is likely to increase. On a larger scale, businesses will record a higher number of clients, some will higher additional workers and the economy will flourish.
Unemployment Rate
Second, they look at the unemployment rate. This number usually shows the percentage of people of working age who are not at work. A reduction on this rate is usually very good. It is usually a sign that businesses are thriving, hence the need for more employees.
The unemployment rate rises in a period when the economy is not doing well. As shown below, the rate surged to a multi-decade high of over 14% when the Covid-19 pandemic happened in 2020. It then dropped to a multi-decade low as the economy emerged from the pandemic.
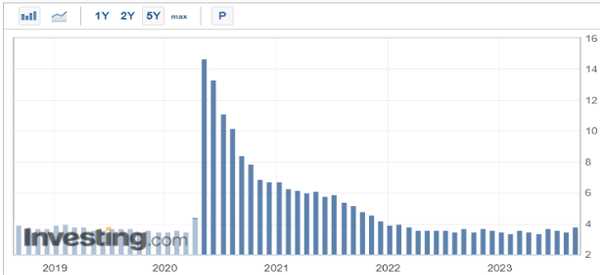
The U6 is often called the official unemployment rate because it captures a larger net. The U6 unemployment rate is made up of the number of people who are unemployed, underemployed, marginally attached, and discouraged. In most periods, this figure is usually bigger than the official unemployment rate.
The unemployment rate has a relationship with inflation known as the Philip’s curve. The theory is that a low unemployment rate leads to higher inflation. As a result, the Fed is often inclined to hike interest rates in a period of low unemployment rate.
Participation Rate
Third, they look at the participation rate. This rate shows the percentage of the population that is actively engaged in work. An increase in participation rate is usually a good thing for the economy.
This is because it tends to increase the productivity of the population.
When the employment number is released, a few things can happen. A sudden improvement can lead to a stronger dollar as people start feeling good about the economy and the pace of rate hikes.
As it does this, the yields on the treasuries might increase as people brace for more rate hikes from the Federal Reserve. As the rate increases, the performance of the stock market could move lower as people move to bonds.
Nonfarm payroll
Another set of data that you should look out for as a trader is the nonfarm payroll. It is a measure of the workers in different sectors excluding farm employees. The data also excludes employees in non-profit organizations, business owners, private households, and some government workers.
The figures are released monthly by the Bureau of Labor Statistics (BLS).
One of the key reasons why traders and economists follow nonfarm payroll numbers keenly is its role as an economy indicator. On the one hand, a decline in the nonfarm payroll figure is a signal that the economy is contracting.
Conversely, the rise in nonfarm payrolls signifies an expanding economy.
A good example of nonfarm payrolls as an indicator of a country’s economic growth rate is the April 2020 data. During this period, the WHO had just declared coronavirus as a global pandemic. Businesses were beginning to feel the pinch. Some had to layoff some workers while others closed shop.
Subsequently, nonfarm payrolls in the US dropped by 20.5 million. It was the highest figure since World War II. It was a clear sign that the US economy was contracting. True to the figures, the US dollar index began its downward trend after reaching a 3-year high in late March.
Nonfarm payrolls are also helpful in evaluating the performance of a particular sector. The availed data is grouped into two broad groups: manufacturing sector and the service industry.
For instance, a trader interested in industrial metals such as copper and silver should focus more on the manufacturing nonfarm payroll numbers. A higher figure is a sign of higher demand for products and the subsequent increase in activities within the factories.
Market implications of NFP data
The non-farm payrolls data is one of the most important economic reports in the market. When it comes out, it tends to move all assets like stocks, forex, crypto, and commodities. This happens because of its importance in monetary policy.
Therefore, in theory, a weak jobs report means that the Fed could react by being dovish. The Fed tends to slash rates when the labor market is not doing well. The idea is that low rates will incentivise companies to hire more. As such, weaker numbers lead to higher stock prices.
All this is in theory. In reality, however, the market reaction tends to depend on numerous factors. For example, if the jobs numbers come after the Fed decision, the impact tends to be limited since the bank has already given its guidance.
For example, in 2020 when the unemployment rate jumped to a multi-decade high, stocks jumped and the US dollar retreated. This happened as investors priced in an intervention by the Federal Reserve, which it did.
Summary
In this article, we have looked at the key aspects of the non-farm payrolls (NFP) data. We have highlighted the key parts of the report like the unemployment rate, non-farm payrolls data, wages, and participation rate. We have also highlighted how these numbers impact the financial market.
External Useful Resources
- Surfing the Jobs Report: Why It Matters and Strategies for Trading It – The Ticker Tape

