

The economic calendar is a very essential tool that traders use to gauge the health of the economy. Among the most important components of the calendar are:
- Employment numbers
- Industrial and manufacturing production
- Interest rate decision
- Manufacturing and services purchasing managers index (PMI).
In this report, we will look at this last one, what it is, and how you can trade it.
Table of Contents
What is the PMI?
The Purchasing Managers Index is a special economic number that is used to gauge the health of the manufacturing and services sector. The report is done by various organisations by surveying purchasing managers in companies in the specific sectors. IHS Markit, an American company valued at more than $33 billion is among the biggest providers of this data.
Every month, the company publishes the PMI data from hundreds of companies. Other prominent providers of the manufacturing and services PMI data is the Institute for Supply Management (ISM) in the US, Ivey Institute in Canada, China Logistics, and Caixin.
In general, the PMI number usually ranges between zero and 100. A reading value of 50 and above is usually a sign that the specific sector is expanding while a reading below 50 is usually a sign of contraction.
A good example of this is what happened at the height of the coronavirus pandemic when the services and manufacturing PMI in most countries fell below 30.
What does the PMI include?
As mentioned above, the index is calculated by surveying purchasing managers in various sectors. This is usually a combination of five key sectors of the economy. It looks at:
- New orders
- Employment in the specific sectors
- Input costs
- Time taken to fulfil orders
- Output among the industries.
How is calculated?
The PMI is calculated by looking at the five gauges mentioned above. The researchers usually place multiple weights on the data. For example, new orders is given more weight that confidence.
After conducting the survey, the researchers then use the following formula:
In this formula, P1 is the number of participants who are reporting improvement while P2 is those who are reporting no change. P3 refers to people reporting deteriorating conditionns
| PMI = (P1 X 1) + (P2 X 0.5%) + (P3 x 0) |
Popular types of PMIs
The four most popular types of PMIs that analysts pay a close attention to are:
- Manufacturing PMI – This is a number that provides information about a country’s manufacturing sector. It is most useful in countries like the US, China, Germany, and UK that have vast manufacturing operations.
- Services PMI – This number looks at activity in the services sector such as restaurants and aviation. It is usually highly important because the services sector is usually the biggest employer in most countries.
- Construction PMI – This figure looks at the performance of the construction industry. It is a good one for those trading construction stocks.
- Composite PMI – This PMI looks at key data in the manufacturing and services sectors and provides a gauge of the entire economy.
How to trade the PMI number step-by-step
A common question among traders is on how to trade the Purchasing Managers Index data. Here are the steps you have to follow.
Release Data
First, you need to know when to expect the data. To do this, you need to look at the economic calendar, which is an important tool that shows you the exact time when the specific PMI will be released.
Every month, Markit usually releases two PMI numbers. At the end of the month, it releases the flash manufacturing and services PMI for certain countries. Then, in the first week of the month, it releases the final PMI number starting with the manufacturing data followed by the services PMI.
It is worth noting that not all Purchasing Managers Index numbers move the market. However, a PMI from a specific country could move the specific currency. For example, the services one in the UK is usually important for the sterling because the services sector represents more than a third of the entire economy.
The Previous Trend
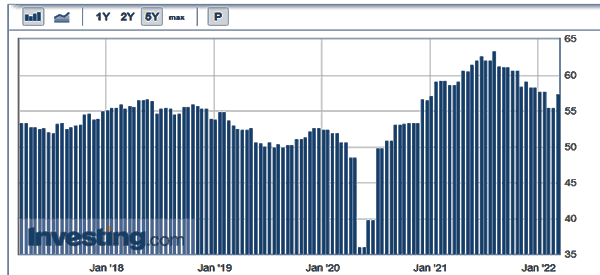
Second, you need to understand the previous trend of the index. For example, a value of 55 may not mean a lot if the previous month’s PMI was 54.5. The chart below shows the trend of the manufacturing index in China.
Effects on Central Banks
Finally, this index is among the various numbers that central banks look at when making their interest rates. Therefore, if the PMIs, retail sales, inflation, and employment numbers have been relatively strong, it means that the bank has a higher probability of raising interest rates.
Interpreting the PMI data
Ideally, the PMI ranges from 0 to 100. A PMI figure of 49 and below is usually a sign that the sector is in a contraction mode. Therefore, if the PMI rises from 40 to 44, it is interpreted to mean that it contracted at a better pace.
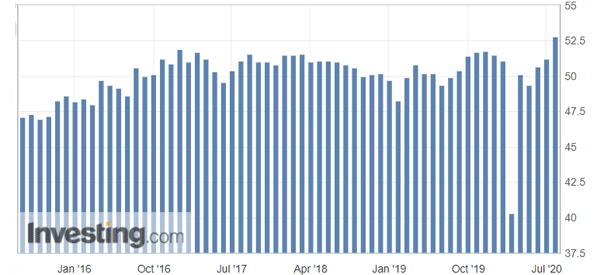
As shown below, the US manufacturing PMI declined to a record low during the first months of Covid lockdowns.
Second, a PMI reading of 50 and above is a sign that the sector is improving. Therefore, if other numbers like employment and inflation are showing the same thing, the central bank could turn hawkish.
Pros and cons of PMI
While the manufacturing and services PMI are good numbers, they have their pros and cons. The first pro is that they are useful indicators of how the economy is doing. Second, they tend to provide deeper insights about companies and the factors that are affecting them.
The main con is that the PMI number usually does not lead to substantial market movements. In fact, currencies and stocks rarely move when they are released. Further, the PMI does not capture the real situation in a country. For one, the researchers only survey a small group of companies
Final thoughts
Knowing how the economy is performing is among the most important aspects in fundamental analysis. Important because it helps you know what to anticipate when trading currencies, commodities and stocks.
The PMI is an important number that has provided a useful gauge about the economy’s performance and is also an important tool followed by Wall Street analysts.
External Useful Resources
- What is the Purchasing Managers Index and Why It Matters in FX – FxEmpire
- IHS Markit website

