

Data analysis is an important thing in day trading and investing. In most cases, successful traders rely on in-depth analysis of data to predict what will happen in the future.
To do this, they rely on historical data and other tools like technical indicators. In this article, we will look at what this look back at the data is and how to use it in day trading.
Table of Contents
What is historical data?
Companies in the financial industry like brokers and cryptocurrency exchanges deal with data all the time. They record and store data of key financial assets like stocks, currencies, and commodities.
Once collected, this information shifts to become historical data. This explains why you can easily find out how the Dow Jones index was trading in the 1930s.
Types of historical data in trading
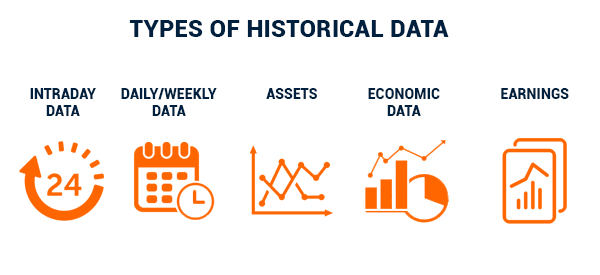
There are several types of historical data in trading. First, there is intraday data, which refers to data that happens in a certain market session.
Second, we can look at daily, weekly, or monthly data. These are numbers that happen in a certain period.
Third, data can be grouped in terms of assets. The most popular assets in the financial market are stocks, commodities, exchange-traded funds (ETFs), and forex.
Further, there is historical data relating to economic data. Some of these numbers include data on inflation, manufacturing, jobs, and industrial production.
Another type of data is on earnings. It refers to how a company publishes its financials every quarter. You can use these numbers to identify the trend of the company’s performance.
Related » Trading with Oscillators: Best Practices and Caveats
Why historical data is important
Traders and investors rely on historical data for several reasons. First, they can use this data to learn an asset’s trend. A good example of this is shown in the chart below. As we can see, the stock soared to about $40 in 2021 and then started moving in a bearish trend and moved to below $5.
Therefore, a trader can easily know that Bakkt is not a good investment. Without this historical data, it is almost impossible to know whether it is a good buy or not.

Second, historical data is useful in creating financial models. Most traders and investors rely on different financial models that look at different things. In most cases, these models rely on historical data.
Third, this data is used to create technical indicators like moving averages, relative strength index (RSI), MACD, and the Stochastic Oscillator. Without this information, trading would be an extremely difficult activity to do.
Where to find historical data
Data has become the most important asset in the world today. Financial data, in particular, is highly valuable, which explains why hedge funds pay thousands of dollars per month for tools like Bloomberg Terminal and Refinitiv Eikon.
Still, there are many companies that provide this data for free. For example, popular platforms like TradingView and InvestingCube are loaded with vast historical data. You can use their charts to conduct your analysis.
A platform like MT5 provides raw data that you can download and incorporate in Microsoft Excel to create models.
How traders use historical data
As mentioned above, there are many uses of historical data in the financial services industry. Let’s analyze some of the top uses of these numbers for a day trader (even investors can rely on these data).
Backtesting a strategy
Backtesting is the process of using historical data to predict the performance of a manual or automated strategy. A good example of this happens when a developer creates an algorithmic tool that is known as a robot.
Most trading platforms like TradingView and MetaTrader usually have a strategy tester tool that automates the process of backtesting. You simply need to create a robot and use the strategy tester to test its performance using historical data.
Backtesting differs from forward testing, which is a process that uses a model of how a tool like a robot will perform in the future.
Identify seasonality
Stocks and other financial assets usually trade in different ways in certain periods. For example, historically, there is usually low volatility during the summer months.
Also, a Santa rally tends to happen toward Christmas Day. Chinese stocks also remain closed during the Lunar New Year. Therefore, using historical data can give you more information about seasonality.
Identify historical volatility
Historical volatility refers to the standard deviation of asset prices and how they deviate from their average.
Since this volatility is related to prices, it relies on historical data. It includes calculations like moving averages and standard deviations.
Identify trends
Another way to use historical data is to identify trends in the financial market. For example, by looking at a stock performance over time, you can tell whether it is a good investment or not.
If a stock is continually rising, then, as a trend follower, you can buy it and wait for a reversal. Similarly, if a stock is falling, then you can use this information to short the shares.
How to use historical data well
Multi-timeframe analysis
A popular approach in historical data analysis is known as a multi-time frame analysis. This is a process where a trader or investor uses several periods to predict the direction of an asset in the future.
The idea is that using a one-period chart could give you the wrong information. As such, traders start their analysis from a longer chart, such as a daily chart and then move down to hourly or daily.
Financial modeling
The other approach to use historical data is in financial modeling. A trading financial model is tool that is used to estimate the performance of a strategy.
For example, you can create a financial model that incorporates several technical indicators to predict the future performance of an asset. A model can also include other external factors like interest rates.
Pitfalls of using historical data
There are several pitfalls of using historical data in trading and investing. Some of these pitfalls are:
- Historical bias – We recently looked at recency bias, which involves looking at the most recent data. There is also historical bias, which involves relying on historical data. At times, relying on this data can see you make mistakes.
- Randomness – A common statement is that historical performance cannot be used to predict future performance. Besides, there is a situation known as randomness.
- Cannot be used alone – Another thing is that using historical data is not enough. Instead, it should always be used in addition to other analysis methods like fundamental analysis.
Summary
This article looked at the concept of historical data and how to use it well in the market. As we have seen historical data refers to all past numbers, including prices, economic number, and also financial performance. You could use this data to predict the future performance of a financial asset.
External useful resources
- 3 approaches for backtesting historical data – Medium

