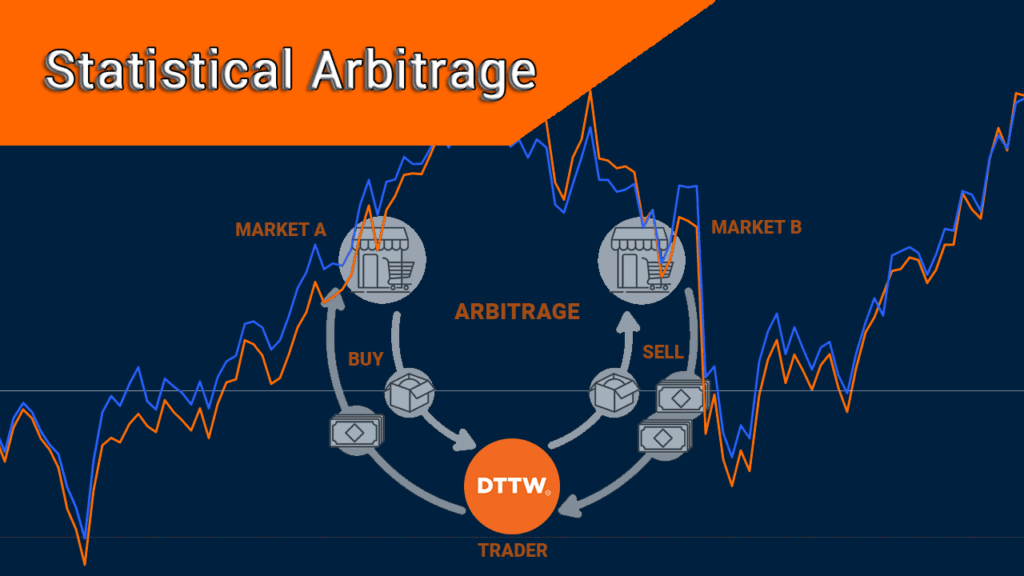
As We have written before, there are thousands of strategies that you can use as a trader to maximize your profits. Some of the strategies we talked about before include:
- Hedging trading
- Algorithmic trading
- Scalping
- Value investing among others
In addition, there are traders who focus on technical analysis while others focus purely on fundamental analysis.
Table of Contents
Arbitrage Strategy: Strategies to Maximize returns
The secret to maximize your profits is to focus on one or two strategies. The more strategies you use at the same time, the more mistakes you are likely to do.
In this article, we will focus on statistical arbitrage. Statistical arbitrage is a jargon: everyone who hears the word gets the wrong impression. They think it’s a tough strategy involving tough mathematical models and calculations.
It’s not!
In fact, statistical arbitrage is one of the easiest strategies that one can use out there.
The profits made using the strategy are not as much, despite it is one way you are certain that you could make huge amounts of money.
Statistical arbitrage (SA) is a complex word used to refer to pairs trading. It is a simple way of using hedging as a strategy. In SA, you take two assets and trade them in the opposite direction.
For instance in a normal silent day, one without major news coming in:
- two similar assets will trade in the same direction
- two companies in the same sector will trade in the same direction
- oil companies such as Exxon Mobil and Chevron will ‘always’ trade in the same direction
This is because their fundamentals are almost certain. If the price of crude oil goes down by 4%, then chances are high that the two companies mentioned above will be impacted through spill over effects.
In the same way, retail companies such as Target and Walmart will follow one another. The same is in the commodities market.
Types of statistical arbitrage
There are several types of statistical arbitrage that you can use in the market. These ones are:
- Market neutral arbitrage – This is a complex process where a person buys an undervalued stock and shorts one that is overvalued. In most times, this approach does not work well.
- Cross-asset arbitrage – This is where you trade two assets in different markets. For example, you can buy crude oil and then short an oil stock.
- Cross-market arbitrage – This is where you seek to benefit in the price differences offered in various brokers. It is popularly used in the cryptocurrency industry.
- ETF arbitrage – This is where you seek to benefit from the differences in two ETFs. For example, the Vanguard S&P 500 and Schwab S&P 500 funds always move in the same direction.
- Volatility arbitrage – This is a type of arbitrage that is mostly used in the options market. It involves buying a long position for a call option and then short the underlying asset.
Practical Example of Statistical Arbitrage Strategy
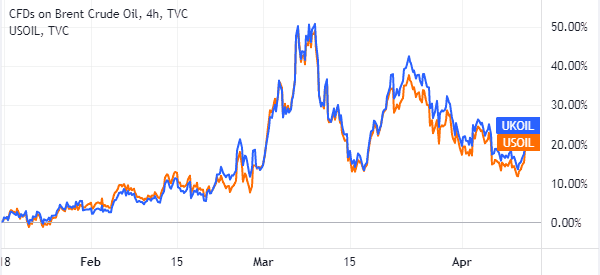
For instance, the West Texas Intermediary (WTI) and ICE Brent crude will move in the same direction. Their correlation is almost perfect.
In statistical arbitrage therefore, the goal is to identify companies or asset classes that have a unique level of correlation and then open two trades simultaneously.
In case of a perfect correlation situation, you will open opposing trades. In the case of Brent and WTI crude, you will open long and short trades.
Your goal is that WTI (which you bought) will go up and Brent (which you short) will go down. Then, your profit will be the differential. Assume that Brent makes you $200 in profit while WTI makes you a $100 loss, your profit will be $100. Therefore, you will mitigate the negative loss.
A good example of how to use statistical arbitrage in trading is in the oil market as shown below. As you can see, the two benchmarks move in the same direction. Therefore, if you believe that oil will rise, you can buy more Brent and then short some WTI.
Use Statistical Arbitrage on equities
When trading equities, it will not always work out that way in the short term. For instance, assuming that Walmart and Target have been trading perfectly for the last week and there is no financial release coming up. Then, on this day, a ratings agency downgrades Target.
Chances are that the cycle will be broken and you will likely make a loss. In the case of equities, how do you determine the company to long or short?
One, the companies need to be related. For example, in case of the energy sector, you can use oil companies such as Exxon and Chevron. Alternatively, you can use an oil company such as Exxon and an oil servicing company such as Halliburton.
Second, you need to conduct a thorough analysis of the two companies. A correlation is a good way to start, and Yahoo Finance is good to get the data for analysis.
The same will be true for other asset classes.
Statistical arbitrage in ETFs
Another popular statistical arbitrage trading strategy is in ETFs. For starters, an ETF is a financial asset that tracks a basket of financial assets like stocks and bonds. Fortunately, many ETFs track similar financial assets.
For example, as shown below, the Vanguard S&P 500 and the SPDR S&P 500 ETF track companies in the S&P 500. As shown below, the two ETFs usually move in the same direction.
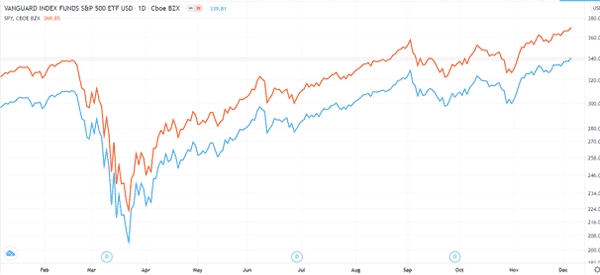
However, as you can see, the SPDR ETF is a bit expensive than the Vanguard ETF. The two have a spread of about $20. Therefore, you can easily use statistical arbitrage for this investment.
How?
If you believe that the two will continue rising, you can buy a bigger amount of the Vanguard ETF and then short a small amount of the SPDR ETF.
If it works like that, your buy trade will make you more money while your short trade will lose you a lesser amount of money. In this case, your profit will be the spread between the two.
Mixed statistical arbitrage
It is also possible to use statistical arbitrage across various assets. You can use it across a currency pair and another financial asset like stocks and commodities. A good example is what happens between the US dollar and American equities.
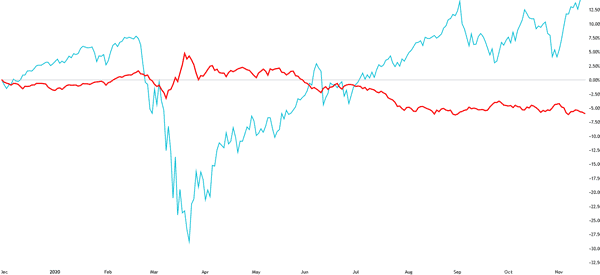
In most cases, the US dollar tends to strengthen when there are major risks in the market. As it does this, the price of stocks drop as investors reposition their stocks. As such, in this period, you can open two simultaneous trades between the dollar index and a major US index like the S&P 500.
This is exactly what happened at the height of the coronavirus pandemic. The dollar soared to multi-year highs while the S&P crashed. Later on, the dollar crashed as risks reduced while the S&P 500 rose to record highs.
How to find statistical arbitrage opportunities
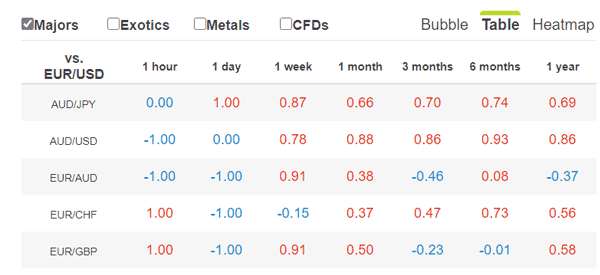
A common approach to find statistical arbitrage opportunities is to conduct a correlation calculation. For starters, correlation refers to the mathematical study of relationships between assets. In the financial market, you can do this by downloading data of two assets and running a correlation study in Microsoft excel.
If the result is 1 or close, it means that the two assets have a close relationship. On the other hand, if the result is close to -1, it means that they have no relationship.
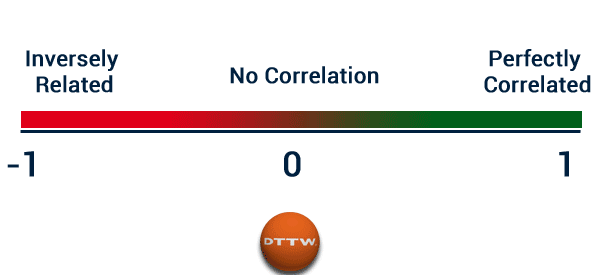
Alternatively, you can use the various free tools to find correlations. In forex, you can use the correlation tool by Oanda, as shown below.
Risks of statistical arbitrage strategy
There is no trading strategy that is 100% accurate. While statistical arbitrage works well, it has its own risks.
Correlation breaks
First, there is a risk when the correlation breaks. This happens because correlation is done using historical data, which don’t always replicate in the future. Therefore, while Brent and WTI tend to move in the same direction, at times, this trend can be broken.
Execution risk
Second, there is the execution risk. If you are a high-frequency trader, the broker can take time to fill your order. As such, in this case, the benefit that you hope to benefit could be gone. In line with this, there is a challenge known as slippage where your order is implemented in a different price.
Individual stock
Third, at times, you could be using a different model to play the arbitrage game. And finally, there is a risk that the strategy will be affected by an individual stock. For example, if you are trading Chevron and Exxon, a news event by one of the two firms could lead to disruption of the model.
Final thoughts
Statistical arbitrage is one of the most popular types of arbitrages you can use in the market. Others are interest rate arbitrage, merger arbitrage, risk arbitrage, and triangular arbitrage, among others. You can use the strategy in all types of assets profitably but you need to study it for a while.
External useful resources
- What are the different arbitrage strategies that are used? – Quora


