A profit and loss (P&L) is an important document that helps traders, investors, and analysts understand the performance of a company. It is also known as an income statement.
It is one of the three vital documents that all public companies are required to publish. The other three are the balance sheet and the cash flow statement.
In this report, we will look at P&L analysis and how you can apply it in the market.
Table of Contents
What is a P&L statement?
As the name suggests, a P&L statement is a document that shows the amount of money that a company makes, how it spends it, and the amount of profit or loss that it generates.
It is a different document from the balance sheet and cash flow statement. The balance sheet shows the total assets and liabilities the firm has. The cash flow statement, on the other hand, shows how the company spends its cash.
Why it matters?
For traders and investors, having a good understanding of the income statement is important, especially during the earnings season.
However, the three documents are usually more important to investors, who want to buy and hold shares in a company for a longer period.
Types of Profit and Loss statements
There are several types of profit and loss statements but the whole idea is the same. The statement typically shows you how the company is performing.
There is the single step income statement, which simply shows the income and expenses in a certain period.
There is the multi-step income statement that shows specific details. For example, instead of having selling expenses, it breaks them into advertising and commissions. This income statement will mostly give you more data about a company.
Next, there is the comparative statement, which shows the same information while comparing it by year or by quarter. This statement tends to give you more details about trends.
» Related: How to do trend trading
The other types of income statements are variance, common size, contribution margin statement, and driver-based statement.
Parts of a profit and loss statement
A profit and loss statement has several sections. Because of how large this field is, we will look at several of these sections for today.
- Revenue – This is the first section of the profit and loss statement. It basically shows the entire amount of money that a company has made.
- Cost of goods sold – The second part usually shows the total costs spent in developing the goods.
- Gross profit – This is the first major calculation in the P&L statement. You simply subtract the revenue and the cost of goods sold (COGS).
- SG&A expenses – These are the sales and marketing and general and administrative expenses. In a P&L statement, these are subtracted from the gross profit.
Other deductions
After subtracting the expenses, you then subtract other items in a business to get the operating income. These deductions include amortization expenses, investment write-offs, and operating interest income.
Again, after getting the operating income, you subtract the non-operating expense and add the non-operating income to get the pre-tax income.
After getting the pre-tax income, you subtract the taxes and other items to get the net income. The net income is the profit that remains in the company.
Example of a P&L statement
There are many places where you can get the profit and loss statement of a company. A common place is to go to the investor relations page of the firm’s website. Alternatively, you can get the data from third party platforms like YCharts, Morning Star, and Yahoo Finance.
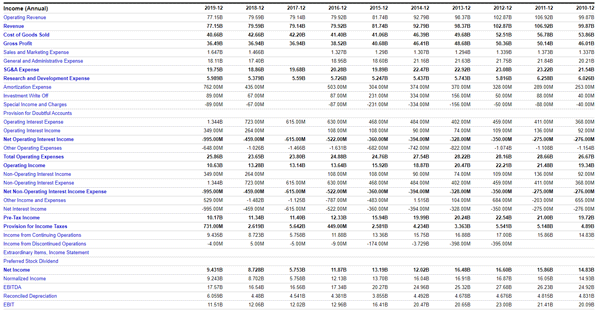
The chart below shows IBM’s ten-year profit and loss statement.

P&L Analysis
As a trader or investor, you need to know how to analyse the income and loss statement. There are several things that you need to know about.
- First, you need to first check out whether the revenue of a company is growing. This is the first thing that market watchers look at.
- Second, you need to look at the growth of SG&A. Ideally, you want a firm that is growing its revenue even as its SG&A falls.
- Third, you need to look at the net income to see whether it is growing or whether it is making a loss.
- Fourth, you need to look at the EBITDA (Earnings Before Interest, Tax, Depreciation, and Amortization) and whether it is growing.
- Finally, you need to look at the earnings per share. This is calculated by dividing the net income with the number of outstanding shares.
In the example above, we can see that IBM’s revenue has fallen from more than $102 billion in 2012 to $77 billion in 2019. Its net income has fallen from more than $16 billion to more than $9 billion.
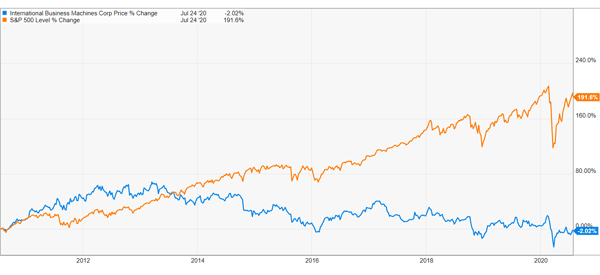
A look at its share price during this time will show that the firm has also underperformed the S&P 500. That shows the correlation of share price and the income statement and share performance.

Profit and Loss statements in day trading
In most cases, profit and loss statements are not all that important for stocks traders. This is mostly because these traders are mostly focused on how a company’s share price is performing within a short duration.
These statements are mostly useful during the earnings season. Most importantly, they are more appropriate for long term traders who want to identify trends of a company. For example, when you are buying a stock for the long-term, you want to know whether its revenue and profits are growing.
In addition to the P&L statement, investors also find a lot of useful information in balance sheet and cash flow statements.
Final thoughts
The profit and loss statement is an important document that forms the foundation of any investment or trading. As you have seen above, the document is relatively easy to understand.
However, there are several items that we have not covered, including how to calculate the gross and net margins, which are equally important.
External Useful Resources
- Profit and Loss statement analysis for Fundamental analysis – Samco


