

Financial traders and investors use numerous strategies and theories when making decisions. These theories help to explain various market movements and events.
Some of the most popular theories or principles are the Wyckoff method, Dow theory, Gann theory, and Elliott Wave theory.
A careful study of these theories will help you understand the various price action movements of assets like stocks, cryptocurrencies, commodities, and bonds. This article will look at the Wyckoff Method and explain how you can use it in both trading and investing.
Table of Contents
Who was Richard Demille Wyckoff?
Born in 1873, Richard Wyckoff was a major player in the financial services industry. He was a trader, investor, and a magazine publisher. He founded the Magazine of Wall Street and was the editor of Stock Market Technique.
Wyckoff loved the financial market, where he started as a stock runner at the age of 15. As he gained experience in the industry, Wyckoff started his brokerage firm.
Using his years of experience studying the financial market, he identified some unique patterns. And like Charles Dow who created the Dow Theory, his principles were compiled into what is known as the Wyckoff Method.
What is the Wyckoff Method?
The Wyckoff Method is a set of principles and rules that Richard Wyckoff observed in his time in Wall Street. He created the approach after observing many novice and highly experienced traders lose their fortune in the market.
The Wyckoff Method is made up of three key parts: Wyckoff market cycle, Wyckoff Laws, and the Wyckoff method itself.
What is the Wyckoff price cycle?
The Wyckoff market cycle is a concept that explains the various phases that financial assets go through. It is based on the concept of demand and supply and is similar to the idea of accumulation and distribution.
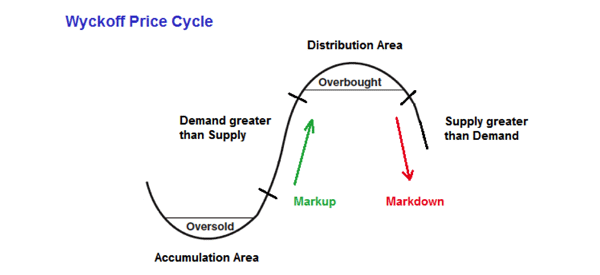
The Wyckoff cycle believes that assets go through four key phases:
- Accumulation
- Mark up
- Distribution
- Markdown
Accumulation is the phase where investors start buying assets slowly and is characterized by the assets remaining in a tight range.
The markup phase is when an asset’s price jumps sharply as demand remains above supply. This phase is characterized by concepts like Fear of Missing Out (FOMO) and following the herd or crowd.
The next stage is known as distribution and is when some of the original buyers start exiting their positions. As the price’s momentum fades, it ushers in the markdown phase, where the asset plunges. This concept is summarized in the chart below.
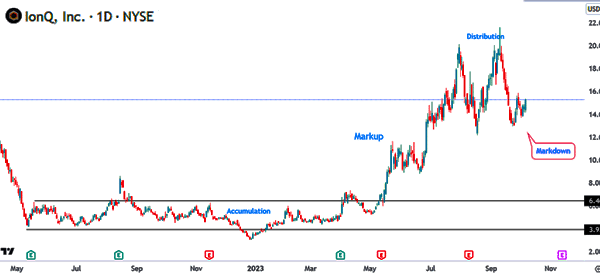
The chart below shows these phases in the IonQ stock. We see that the stock entered an accumulation phase between May 2022 and May 2023. It then moved to the markup phase.
In the next phase, the stock entered a distribution phase and formed a double-top pattern. While the markdown phase has not happened, there is a likelihood that it will happen soon.
What are the Wyckoff laws?
The second part of Wyckoff’s approach is known as the Wyckoff’s laws. These are three sets of principles that help traders and inventors interpret the approach. They are:
Supply and demand
As explained above, the theory is based on the concept of supply and demand. For example, the markup stage happens when the asset has a higher demand compared to supply.
Markdown happens when there is more supply vs demand. Most traders use volume analysis and price action to understand the phase.
Cause and effect
The other part of the Wyckoff laws is based on the concept of cause and effect. It is a situation where the trader looks at the potential price action coming from an existing trading range.
The cause and effect also looks at the idea of accumulation and distribution and the key news catalysts in an asset.
Law of effort vs result
This is the final part of the Wyckoff law, which provides a warning about any change in price movements. A good way to look at this is to compare the volume bars and the price action of a chart.
One of the best ways to look at this is to consider when there are a number of high volume and narrow range price bars after a major rally. This is usually a sign that an uptrend is about to change.
What is the Wyckoff Pattern?
The other part is known as the Wyckoff Method. It is a set of principles or strategies that traders use to identify trends, supply and demand, and reversals in a chart.
When used well, this approach can help you identify profitable buy and sell positions.
How to use the Wyckoff method
The Wyckoff method can be used by both traders and investors. In most cases, it is used by either long-term technical investors and swing traders. Therefore, there are a few steps that you can follow to use this approach well.
Explore the current chart patterns
The first stage in using the Wyckoff Method is to identify charts and assess the state of the chart.
In this stage, you should look at whether the market is in a tight range or whether it is trending. We recommend that you use candlesticks or point & figures charts in this stage.
Identifying stocks moving in harmony with the trend
The next stage is where you identify stocks that move in the same direction as the broader market. You can look at the market in the form of indices like the S&P 500, Dow Jones, or the Russell 2000.
Therefore, if these indices are rising, look at stocks that are moving at a faster pace than the indices.
Focus on stocks with a cause that exceeds your objectives
In the next stage, you should select companies that are in the accumulation or re-accumulation phase.
In this stage, you should also identify the potential cause for the move. These causes include news events like earnings, management change, and monetary policy.
Identify chart patterns and use indicators
Finally, after entering a position, you should incorporate other trading principles to identify positions.
For example, in the IONQ example above, we see that the distribution phase coincided with the formation of a double top pattern. In price action analysis, this is one of the most accurate bearish signs.
Wyckoff trading strategies
There are a few strategies you can use to trade the Wyckoff method. Let’s see some of these approaches.
Combining it with chart patterns
There are two main types of chart patterns: reversals and continuation. Reversals include patterns like double-tops and bottoms and head and shoulders.
Continuations include patterns like bullish and bearish flags, ascending and descending triangles, and pennants.
For example, you can identify a double-top pattern during the distribution phase. You can also buy the dip during the markup phase by identifying patterns like bullish flags and pennants.
Trading breakouts
A breakout is a period when a financial asset moves above or below a range period. As mentioned above, the accumulation phase is usually characterized by an asset trading in a narrow range.
Therefore, one way of trading the breakout is to place a buy-stop above this consolidation phase. In this case, the buy-stop trade will be triggered, pushing the stock higher.
Combine with technical indicators
The other approach is to use technical indicators to identify entry and exit positions. For example, if the asset moves above the accumulation stage, you can enter a bullish trade when it forms a golden cross pattern. A golden cross is when a fast and slow moving average makes a crossover.
You can also use other indicators in technical analysis. For example, you can use oscillators like the Relative Strength Index (RSI) and the Stochastic Oscillator to find overbought and oversold levels.
Additionally, you can use volume indicators like accumulation/distribution and money flow index (MFI) to study the current phase of the asset.
Pros and cons of the Wyckoff method
There are several benefits of using the Wyckoff method, including:
- Market phases – It helps you identify the various phases of stocks and other assets.
- Identifying buy and exit points – The Wyckoff method can help you to identify buying and selling positions.
- Smart money moves – Finally, understanding the method can help you to understand smart money moves in the market.
There are also some Cons of this method:
- Not ideal for day traders – The Wyckoff method is not ideal for use by day traders.
- It can be complicated to most people -Understanding and using the Wyckoff method, especially the schematics can be highly complicated and difficult to master.
FAQs
Is the Wyckoff method effective?
The Wyckoff method is an effective approach for analyzing stocks and other assets. But it takes a lot of practice and expertise to master.
Does the Wyckoff method apply just to stocks?
The Wyckoff method was developed with stocks in mind. Recently, however, it is now applied across all asset classes like commodities and cryptocurrencies.
External useful resources
- A Five-Step Approach to the Market: the Wyckoff method – Stock Charts

