
Not only Candlestick and Bar Chart. You can trade using The Point and Figure chart too!
A common old saying says talks about the many ways of skinning a cat. The same analogy can be applied in the world of financial trading.
Millions of traders participate in the industry every day, and each of these traders use different strategies to make money.
There are those who focus on fundamental analysis and others who focus on technical analysis. On technical, there are those who focus on just a single indicator like the Relative Strength Index (RSI) and those who focus on a combination of the indicators.
In this article, we will focus on a strategy that is not very common.
As we have written before, most traders use candlestick patterns and a few of them use bar charts. There are others who use relatively unknown charts like the Point and Figure.
This is a type of chart that is not very common but one that can help you identify quality signals.
Table of Contents
What is Point & Figure Chart?
Point & Figure is a chart system, one of the oldest tools used in trading. It was first written about in the Wall Street Journal in the early 1900s by a writer who has not been well-written about. There is not one person who can claim to be the discoverer of the indicator.
In the early days of trading, traders used various methods of recording price action. The point and figure was born from the need to remove unnecessary noise in the market. The figure chart, which showed the prices of an asset was the first to be used.
Later on, traders started replacing the figures with specific points. As the trading industry advanced, they replaced this with the Point and Figure chart.
Jeremy du Plessis wrote more about the history (and many, many more things) about this topic in ‘The Definitive Guide to Point and Figure‘.
Today, this kind of charts have been computerized and one can find them in a number of charting software. To install it in the Metatrader, you need to download it from the marketplace and install it. You can also find a limited version of it in Trading View.
How to Build (and read) a Point and Figure
When using a computer, you just need to automatically add the Point & Figure system directly. To construct it, you need three main components:
- A reversal size parameter
- A box size parameter
- The price data.
A good example of a Point and Figure system is shown below.
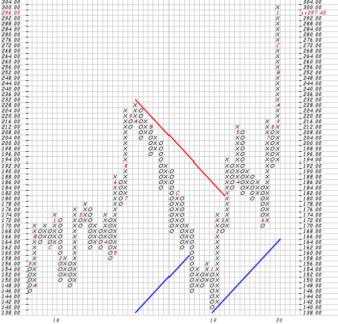
This chart is of Apple and is derived from Stockcharts. As you can see, the chart does not have the time. This is because the goal of Point & Figure is to remove the noise brought by the time factor!
Another thing, you can see X and O. X happens when the price moves up while O happens when the price is moving downwards. The numbers (1,2,3) are used to indicate the month.
The other part of reading the point & figure is when you have X/O in the opposite column. This is usually a sign that a potential reversal is about to happen. But in this case, traders should wait for more confirmation.
Further, there is the concept of the box size, which defines the price range of each box. For example, in traditional scaling, the price range of under 0.25 can have a box size of 0.0625 while a range of between 5 and 20 can have 0.50. A price range of between 1,000 and 25,000 can have a box size of 50.
The other approaches to determine the box scaling are the percentage, dynamic ATR scaling, and user-defined box scaling
Point and figure vs candlesticks
A common question is on which is better between candlesticks and point and figure. While each trader uses their own trading approaches, the candlestick charts tend to be better. This makes them the most popular trading charts in the market so far.
This is because candles usually provide more information than other charts. For example, they provide more information on the opening, closing, high, and low levels of the chart.
They also provide the time, which can help you predict the future. Most importantly, candlesticks are usually ideal when you are using price action strategies like triangle and double-top analysis. Candlesticks are also easier to use for new traders than point and figure charts.
Still, there are many day traders who strongly believe in points and figures because they filter the time aspect.
Most notably, point and figure charts are difficult to access. They are not provided in MT4 and they are premium in TradingView. This means that you can only access them in the daily, weekly and monthly chart.
In terms of usefulness, point and figure charts are usually better than line charts but they are harder to use than bar charts.
Point & figure vs renko charts
In the previous sections, we have looked at the point & figure (P&F), what it is, and how it helps traders and investors make decisions. P&F charts are often confused with renko, which are also popular among some advanced traders. A renko chart is one that ignores time and instead focuses on an asset’s price change.
A key difference between the two is that instead of using the X and O columns, renko charts use bricks that represent a fixed price move.
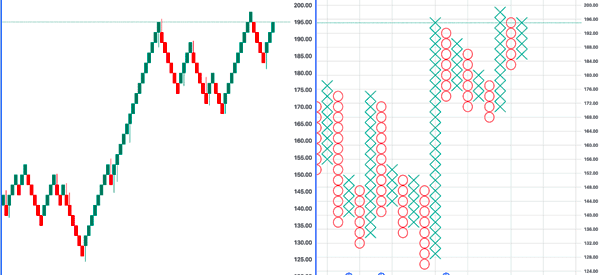
In some cases, these bricks are known as blocks or boxes that move up or down in 45-degree lines with one block per vertical column. The chart below shows Apple shares with the renko on the left and point & figure on the right.
How to Trade Using the Point & Figure
There are several ways of trading using the Point & Figure pattern.
The most popular is to identify the support and resistance levels. A basic way to remember the support and resistance levels is that the support is the floor while resistance is usually the ceiling.
A support happens when there is a sequence of O columns while resistance happens when there is a series of X columns with equal highs.
The rule is that you should buy when the price is in a support level and short when it is in a resistance level.
Using indicators when using P&F
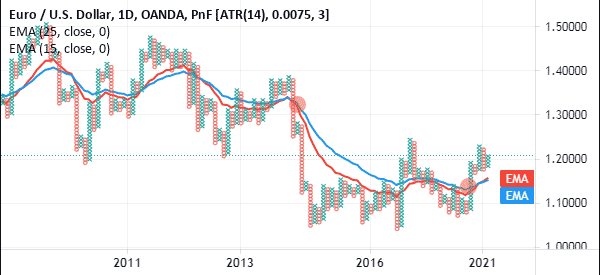
Some day traders use technical indicators like the moving averages and the Relative Strength Index (RSI) when using point and figures. A popular approach is to combine two moving averages with the goal of finding their crossovers.
While each trader is different, the common figures are 15-day and 25-day moving averages. A buy signal emerges when the two indicators crossover when the price is pointing higher. Similarly, a sell signal comes out when the two crosses over when the price is pointing lower, as shown below.
For long-term traders, the most popular averages are 50 and 200.
However, it is worth noting that most indicators are not ideal when using these charts. That’s because most of them are based on time, an aspect that the point and figure chart attempts to avoid.
Pros and cons of P&F charts
Pros
- They show a trend clearly – These charts provide more details about a trend well because they focus on price changes.
- Reduce market noise – The chart reduces the noise in the market by ignoring minor price movements.
- Simple to use – While the chart’s concept may seem complicated, it is fairly to use among experienced traders.
Cons
- Ignore the time factor – Unlike other chart types, it ignores the time element, which is important in the market.
- No OHLC – The chart does not give traders more information about an asset’s open, high, low, and closing prices.
- Delays – The other con for using point and figure is that it is usually ripe for delays, especially when there is a major breaking news.
Summary
Point & Figure is not a very common way of trading stocks and currencies. Nonetheless, it is used by a small number of professional Wall Street traders.
In this article, we have just covered the surface of the strategy.
For you to succeed, we recommend that you take time to test it using a demo account. You should also read about it and watch videos about it.
External Useful Resources
- Introduction to P&F Charts – StockCharts
- P&F Charts [Video] – Trading Tips

