

Bar charts are relatively popular types of charts that are offered by most trading platforms like the MetaTrader and TradingView. Many brokers and exchanges also offer it on their custom trading platforms.
This type of chart is an alternative way for a trader to monitor the price movement of an asset and spot trends to take informed decisions.
In this article, we will describe what a bar chart is and how you can use it for profits as a short term trader.
Table of Contents
What is a bar chart in trading?
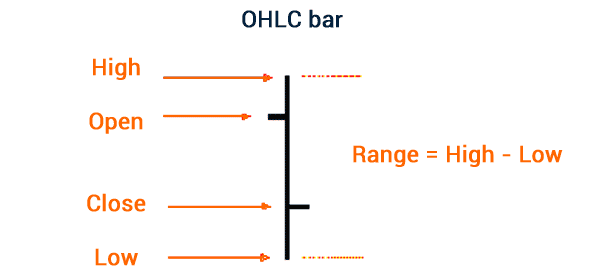
A bar chart is a type of chart that provides you with four important pieces of information when trading. It shows you the opening price, the period’s high and low, and the closing price. These are also known as OHLC.
With this information, you can clearly tell what is happening in a certain period. For example, in a daily chart, the highest level of a bar chart will be the highest level in that day while the lowest part will be the day’s low.
A bar chart’s color can be changed. On TradingView, the default colors are red and green. When you see a red bar, it means that the price opened lower and closed lower. Similarly, if you see a green bar, it means that the asset’s price opened lower and closed high. You can tweak these colours using the settings tab.
In these charts, the open and close prices are usually indicated as a left and right feet, respectively. The chart below shows how a bar chart looks like.
Parts of a bar chart
As mentioned above, the bar chart has four distinct parts:
- High – This is the top-most part of a bar chart. It simply represents the highest point in a session. In a hourly chart, it shows the highest point that hour.
- Low – This is the lowest part of a session. In a hourly chart, the lowest part represents the lowest level in a given period.
- Open – This is usually shown as the left arc and it usually shows where the session started.
- Close – This is the closing price of the session.
- Body – The body of a bar chart is the range between the highest and lowest points.
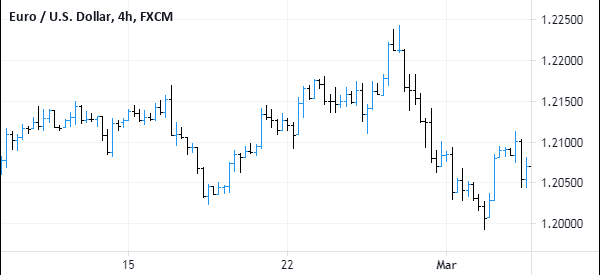
The chart below is a four-hour EUR/USD chart. It shows that the currency pair has dropped for 28 consecutive hours. That’s because each bar represents a four-hour session.
Bar chart example
Alternatives to the bar chart
In addition to bar charts, there are other popular chart types in the financial market. Some of the most well-known are:
- Candlesticks – These are the most popular chart types. Like bar charts, they show the OHLC and a body.
- Line chart – This is a chart type that connects the closing prices of an asset. It is mostly used to show the overall trend.
- Area chart – An area chart is similar to a line chart. It connects the closing prices of a chart and then fills the area between the line and the Y-axis with a colour. Like line charts, area charts are not mostly used in trading because they show limited information.
- Points and figures – This is a chart popular among advanced traders. It plots a price of an asset without factoring time. The result is a chart with a series of Os and Xs.
- Kagi chart – Similar to points and figures, Kagi charts are used by advanced traders. They are simply line charts that change direction when the price moves in a certain amount.
Other popular alternatives to bar charts are baseline, renko, range, hollow candles, and heikin ashi, among others.
How to use a bar chart in trading
For most traders, we recommend that you use candlesticks in trading. Candles are the most widely used charts and usually show more information than bar charts.
Define the right timeframe
To use a bar chart, you first need to identify the type of trader that you are. This will help you select the right period in your chart.
For example, if you are a scalper, you should use a bar chart with less than 15 minutes. That’s because you simply want to buy and sell an asset within a few minutes.
Similarly, if you are a swing trader, you should use a bar chart that is about 4 hours or less. If you are a long-term trader, you should use long bar charts.
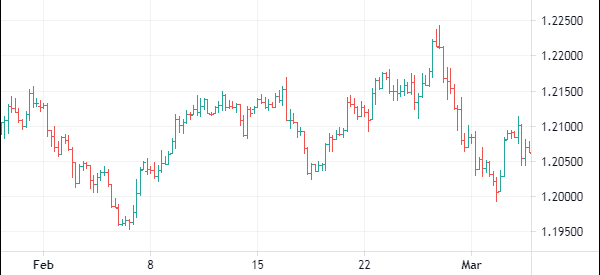
Customize
Second, you should adjust the bar chart to fit your trading preferences. All trading platforms like TradingView and MetaTrader have tools that help you customize the appearance of the chart.
For example, the chart below shows the same bar chart shown above but in a different colour scheme.
Conduct your technical analysis
Finally, you should conduct a technical analysis on the chart. This involves using indicators like the moving average, Relative Strength Index (RSI), and MACD to conduct your analysis. Also, you should use the several price action techniques like triangles, pennants, and flags to predict the next moves in the asset’s price.
Using bar chart for trend trading and reversal
One of the approaches for using bar charts is to trade trends and reversals. A trend is a situation where an asset is either in an uptrend or a downtrend. In most cases, a trend is the best way to trade by either buying low and selling high or shorting high and exiting low.
One way of using bar charts to trade trends and reversals is to use technical indicators like moving averages and Bollinger Bands. A good example of this is in the chart below.
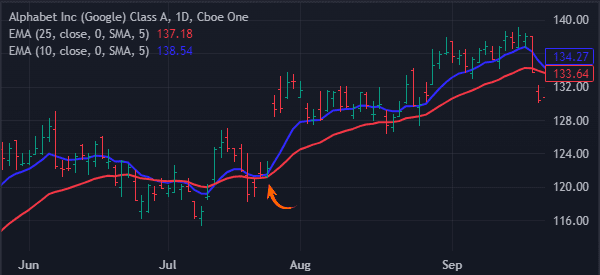
In this chart, we see that the 25-day and 50-day Exponential Moving Averages (EMA) made a bullish crossover, pointing to more upside. Similarly, you can use these indicators to trade reversals.
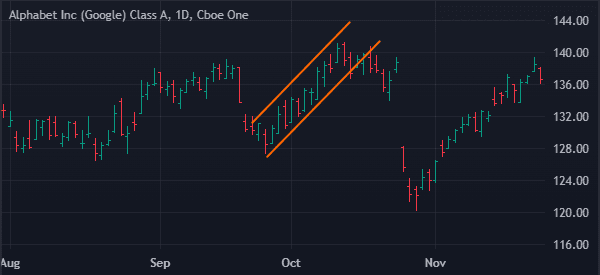
The other approach for using bar charts to trade is to use trendlines that connect support and resistance levels. In the chart below, we see that the stock was in a strong uptrend. In it, the stock remained in a trend as long as it was inside the ascending channel. A reversal, in this case, was confirmed when it moved below the ascending channel.
Inside and outside bars
Inside bar pattern
The other approach for trading reversals and continuations is using the inside bar and outside bar strategy. Inside the bar is a situation where the initial green bar is long and is followed by a small bar. A good example of this inside bar is shown below.
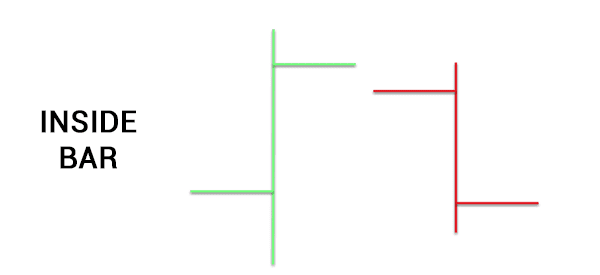
In this chart, we see that the initial bar was a green one followed by a small red bar. This is usually a bearish sign in the market.
However, the best approach is to wait for the price to move above or below the upper or lower swings. In the above case, you can place a buy-stop above the upper swing and a sell-stop at the lower side.
Outside Bar pattern
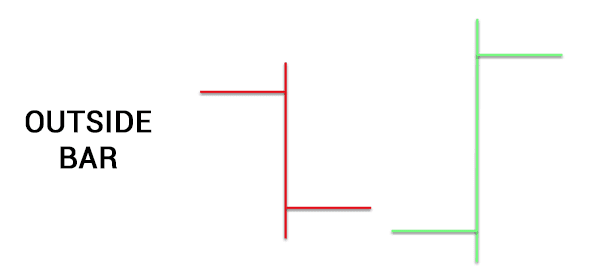
The other approach is known as the outside bar pattern, which is often seen as a reversal one. In most cases, this pattern tends to form during a downtrend.
It is characterized with a smaller red bar followed by a longer pattern. The idea is that it forms a sign that the bearish trend was starting to wane.
Like the inside bar pattern, the best approach to trade the outside bar pattern is to use buy-stop and sell-stop.
Pros and cons of using bar charts
There are several benefits of using bar charts in technical analysis. Some of them are that it is relatively easy to use, it shows the most important levels (OHLC), and it shows clearly the direction of the financial asset.
The key cons are that it is relatively difficult to plot support and resistance levels when using a bar chart.
Final thoughts
Bar charts are the second most popular types of charts in the market after candlesticks. They are available in all trading platforms and show more details than the popular line and area charts.
However, as mentioned, we recommend that you test your ideas also with candlesticks and practice, in any case, in a demo account.
Ecternal Useful Resources
- How to Construct a Futures Market Bar Chart – Futures Trading Charts

