

There are hundreds of indicators, put into several categories, available in most trading platforms. There are trend indicators like the Parabolic SAR and oscillators like the relative strength index (RSI). These indicators are used to show whether there is a trend while oscillators are used to identify key levels such as overbought and oversold.
There are other tools that are categorized as volumes indicators. These are essential because they help to identify whether trends are supported by most traders.
Examples of volumes indicators are volume, money flow index, and the accumulation and distribution indicator.
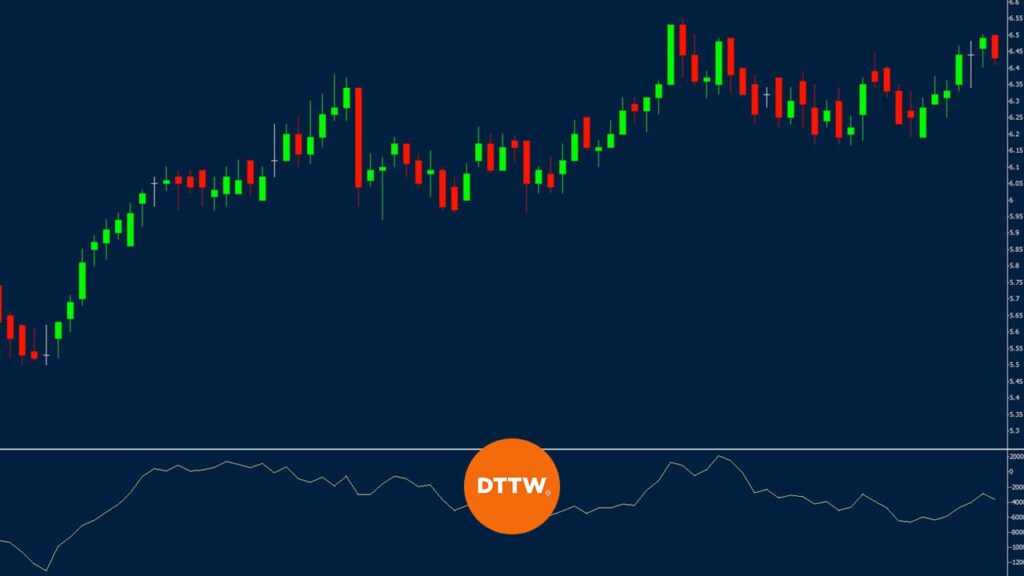
In this article, we will look at the accumulation and distribution indicator and how it works to find out the strength of a trend. The chart below shows how the A/D indicator looks like in a chart.
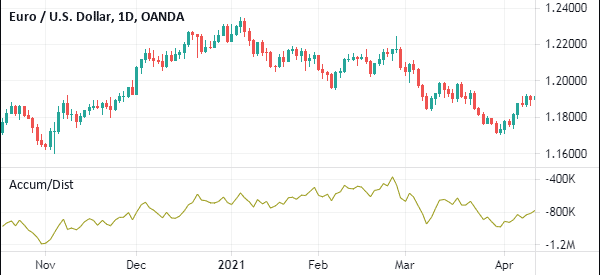
Table of Contents
What is the Accumulation/Distribution Indicator?
The accumulation/distribution (A/D) indicator is one of the most popular volume-based indicators in the market. It was developed by Mark Chaikin, who is also known for developing the Chaikin Oscillator.
The indicator measures the cumulative flow of money into and out of a financial asset. When applied in trading platforms like metatrader, the accumulation/distribution indicator appears as a line moving upwards or downwards.
The idea behind the accumulation and distribution is a relatively easy one. In most cases when the price of an asset is rising, many traders and investors tend to buy. This is usually the distribution phase. It then reaches a stage where they start exiting, which is known as distribution.
It is a similar concept to the Dow Theory, which we have covered before.
How to Calculate it
The A/D is calculated using three important steps. First, you calculate the money flow multiplier. You then calculate the money flow volume and the accumulation distribution line.
Step 1 – The money flow multiplier is calculated by first calculating the close and low prices. You then subtract the close from the high. You then subtract the two results and divide it with the high minus low.
Step 2 – The money flow volume is calculated by multiplying the money flow multiplier with the volume of the period.
Step 3 – The A/D line is calculated by adding the previous ADL with the current period’s money flow volume. As such, the A/D will always fluctuate between +1 and -1.
What Does the Accumulation/Distribution Indicator (A/D) Tell You?
As mentioned, the accumulation/distribution is usually between +1 and -1. A number that is close to +1 is usually an indication of strong buying pressure while a low negative number is usually an indication of buying pressure.
As we have written before, knowing how to calculate the accumulation/distribution is not always mandatory. Instead, you should strive to learn how to interpret it well.
How to Interpret and Use the Accumulation/Distribution Indicator
The interpretation of the A/D indicator is relatively easy. First, you need to ensure that you are using a chart that is trending. A chart that is consolidating is not ideal.
Second, you need to check the default period that is used. To most people, it is recommended that you use the default period.
Finally, you should buy when the A/D indicator is moving higher and sell when it is moving lower. A good example of this is shown on the chart below.
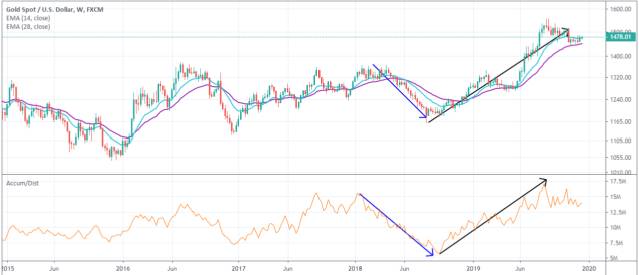
A better option is to use the A/D indicator in combination with other indicators. In the chart below, the indicator has been used in combination with the double exponential moving averages.
You can combine it with the likes of the RSI, Ichimoku Kinko Hyo, and MACD.
Like other popular indicators like the Relative Strength Index (RSI) and Stochastic oscillator, the Accumulation and distribution indicator can be used to find divergences.
Ideally, when the price is rising while the A/D indicator is falling, it is usually a sign that there is a divergence. In this case, it is a sign that the major market participants have started to exit their trades. As such, the price will likely break out lower.
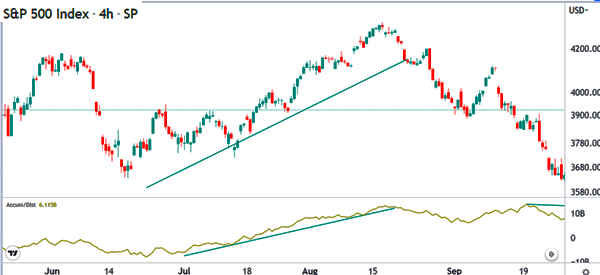
Trend trading with the A/D indicator
Trend-following is a popular trading strategy where a trader buys an asset that is rising or short one whose price is falling.
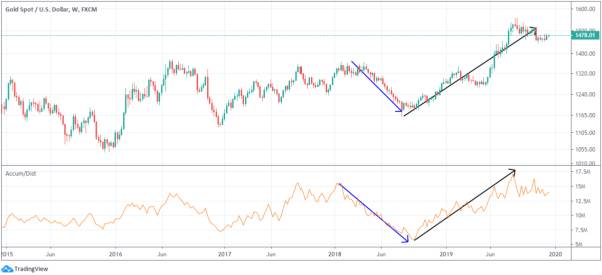
It is possible to use the A/D in trend-following. In most periods, when the asset is rising, the A/D tends to rise. In this case, a trader can buy as long as the A/D indicator is rising.
A good example of this is shown below. After buying, a trader will exit the bullish trade when the A/D indicator starts to flatten. The opposite of this is true. This is where a trader sells an asset when the A/D indicator is falling.
At times, it is possible to trade divergencies, with the A/D indicator. Divergence happens when the indicator is rising while the price is falling. However, most analysts believe that this is usually not a good approach.
A/D vs On-Balance Volume (OBV)
The A/D indicator is often confused with the OBV indicator. Indeed, as shown below, the two indicators look alike when they are applied in a chart.
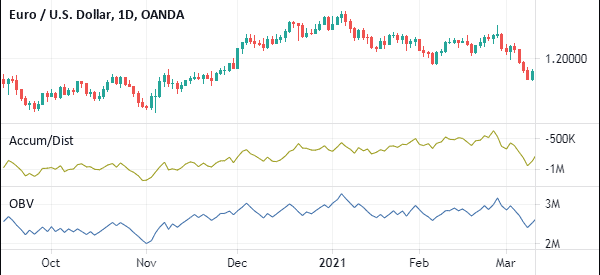
So, what is the difference between the accumulation and distribution and the A/D?
The OBV indicator measures the buying and selling pressure of an asset. It is calculated by adding the amount of volume during up days and subtracting it on down days. Still, the two indicators are used in a similar way.
Pros and cons of the A/D indicator
There are two main benefits of using the A/D indicator, including:
- Easy to use – It is a relatively easy to use indicator.
- Divergences – It is a good indicator to identify divergences in the financial market.
- Available – The A/D indicator is available in all major platforms like PPRo8, TradingView, and MT5.
However, there are several cons when using the A/D indicator. These include:
- It does not send buy and exit signals because of its lagging nature (here some tips to trade laggard stocks).
- It is not ideal for day traders because its signals take time to form.
Summary
The accumulation/distribution is one of the most common technical indicators in the market. It is an ideal volume-based indicator that is easy to calculate and easy to use as well. We recommend that you spend time with it as you create your strategy.
External Useful Resources
- Trend-Spotting with the Accumulation/Distribution Line – Investopedia
- Accumulation Distribution Line on Stockcharts

