

There are hundreds of indicators you can use to trade in the financial market. As we have noted before, these indicators are developed using complex mathematical calculations.
In the past few week, we have looked at indicators like the Relative Strength Index (RSI), Momentum, and Bollinger Bands. This week, we will look at the Chaikin Money Flow (CMF) indicator, what it is and how to use it in the financial market.
Table of Contents
What is the Chaikin Money Flow Indicator?
The CMF is an indicator that was developed by Marc Chaikin (as well as the Chaikin oscillator). The indicator measures the amount of money flow over a period of time. The indicator is the foundation of the accumulation and distribution indicator, which we looked at before.
The CMF indicator is found as a default in the MetaTrader trading software. When applied, the indicator is usually a line that moves up and below the centreline. The general idea of the indicator is that it sums the money flow volume for a specific period.
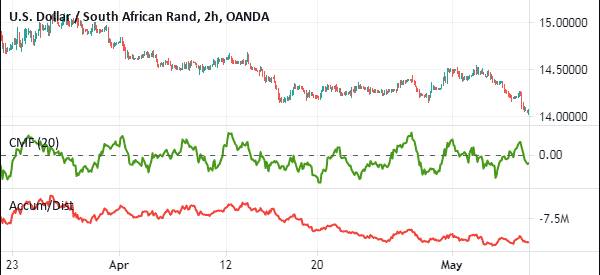
When applied on a chart, the Chaikin Money Flow is a single line that moves up and down. Indeed, it has a close resemblance to the A/D indicator. In the chart below, the CMF is shown in green while the A/D is shown in red. Therefore, if you know how to use the A/D line, the CMF will be an easy to use indicator.
CMF Formula
The Chaikin Money Flow indicator is relatively easy to calculate. The first stage is to calculate the money flow multiplier. You calculate this multiplier by using the following formula.
| ((Close – Low)) – (High – Close )) / (High – Low) |
The next step is to calculate the money flow volume. This is calculated by multiplying the money flow multiplier above with the volume of that period.
Finally, you calculate the CMF by dividing the period’s sum of money flow volume with the period sum of volume.
As a trader, you need to select the period you will use. In most trading platforms, the volume used is usually 20. Still, you can tweak the number depending on your style.
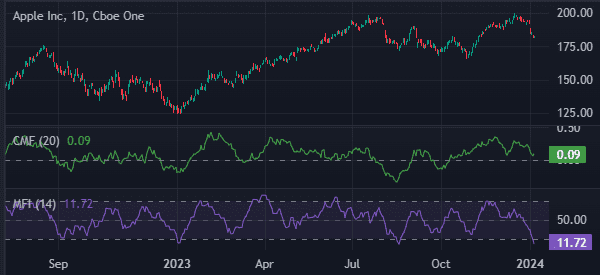
Chaikin vs Money Flow Index (MFI)
A common question is on the difference between the Chaikin Oscillator and the Money Flow Index (MFI). There are a few differences, with the most obvious one being the appearance. The Chaikin Oscillator is made up of one line and a neutral one.
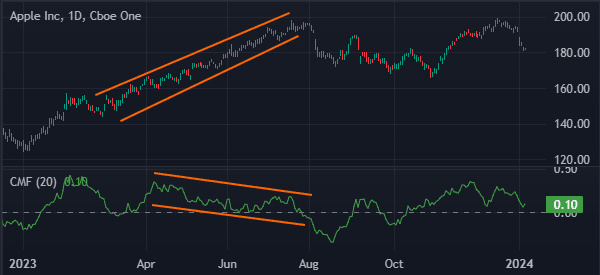
The MFI, on the other hand, is made up of a single line and two more that indicate the overbought and oversold level. In this case, the default oversold level is 20 while the overbought point is 80. The chart below shows the two indicators applied in Apple stock.
The other difference is based on how the MFI indicator is calculated. The first stage is to find the typical price, which is calculated by adding the high, low, and close prices and dividing by three.
In the next stage, you multiply the typical price with the volume to get the real money flow. Next, you calculate the money flow ratio by dividing the 14-period positive money flow with the 14-period negative money flow.
Finally, the MFI indicator is found using the formula below:
MFI = 100 – 100/(1+ Money Flow Ratio)
There are some similarities between the two. For example, the MFI and Chaikin Money Flow indicators can be used to find overbought and oversold levels. These points are usually reached when they get to extreme levels.
Further, the two indicators can be used to find divergences in assets
Chaikin Oscillator vs Chaikin Money Flow
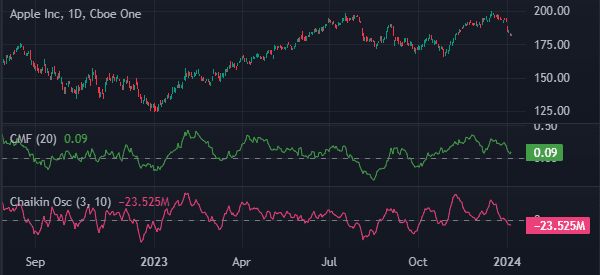
Chaikin Oscillator and Chaikin Money Flow (CMF) were created by Marc Chaikin. They are usually similar in terms of appearance, as you can see below.
The core of the Chaikin Oscillator is that it is based on the accumulation/distribution indicator. Its goal is to find the difference between the 3-day and 10-day Exponential Moving Average of the A/D indicator.
Therefore, it is calculated by first finding the Money Flow Multiplier then the Money Flow Volume, followed by the Accumulation/Distribution Line. The final stage is to subtract the 10-day EMA of the ADL from the 3-day EMA.
The similarity is that the indicators are used in the same manner. They can be used to find divergences, in trend-following, and to find overbought and oversold levels. The chart below shows the Chaikin Oscillator (red) and CMF (green).
Best way to Read the Chaikin Money Flow
Because of how the CMF indicator is calculated, it means that the line usually oscillates between +1 and -1. Still, it is very difficult for it to reach these extremes. This is because, for a 10-period CMF to reach +1, it would take 10 consecutive closes for it to reach +1.
The positive and negative numbers are interpreted as this: When the line is positive, it is usually an indication of more buying pressure. When it is negative, it is usually an indication of selling pressure.
There are two settings you should change when using the Chaikin Money Flow indicator. You can change the length of the indicator to suit your strategy. The default period that is used is 20. You can change this depending on your trading strategy and style. The next item that you can change is the colour of the indicator.
How to Use the Chaikin Indicator
Using the Chaiking Flow Indicator is relatively easy. First, you need to identify a chart that is not in consolidation mode. Consolidation happens when the price of an asset is struggling to find direction. As a result, it usually moves in a sideways direction. The CMF, as with other indicators, is usually not very good when the price is consolidating.
Second, you need to go to the settings of the indicator. You want to select your preferred period. In most cases, you can use the default of the indicator. Finally, you should apply the indicator in the chart.
When you do this, you should look at the historic movement of the CMF indicator. When the indicator is moving upwards, it is usually recommended to buy the asset. Similarly, you should sell the asset short when the indicator is moving downwards or when it is below zero.
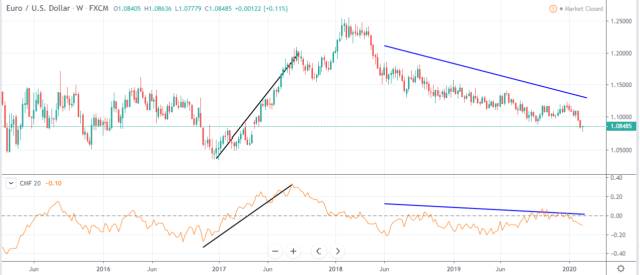
CMF Practical Example
The chart below is a good example of the Chaikin Flow Indicator in use on the EUR/USD chart. There are black and green lines on the chart.
As you can see, the price tends to move upwards when the indicator is moving upwards. This is shown using the black lines below. The blue lines show that the price is moving downwards when the indicator is below the centreline.
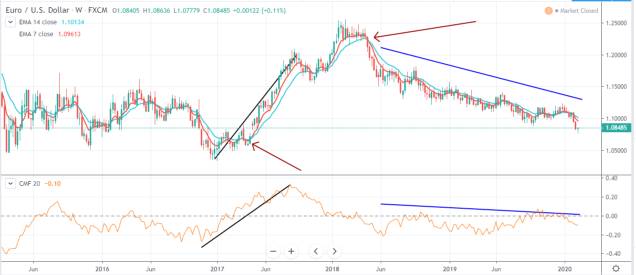
Another way of using the indicator is to combine the indicator with other indicators. The one we prefer a lot is to combine it with a double Exponential Moving Average (EMA). This is when you combine a longer and shorter moving average.
This combination is usually great for finding reversals. When you use it this way, the CMF is used to confirm the new trend. This is shown on the chart below.
Using the Chaikin Money Flow in day trading
Unlike many popular technical indicators, the CMF is not commonly used by day traders. Instead, it is mostly used by long-term traders. The chart below shows the chart applied in a 15-minute chart, which is commonly among day traders. As you can see, the indicator does not tell a lot of information.
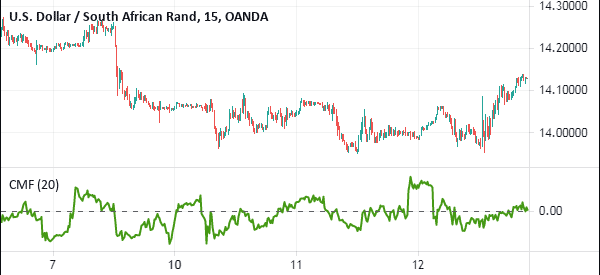
Therefore, if you are a day trader, we recommend that you use other indicators like the moving average and VWAP.
Chaikin Money Flow indicator strategies
Trend following
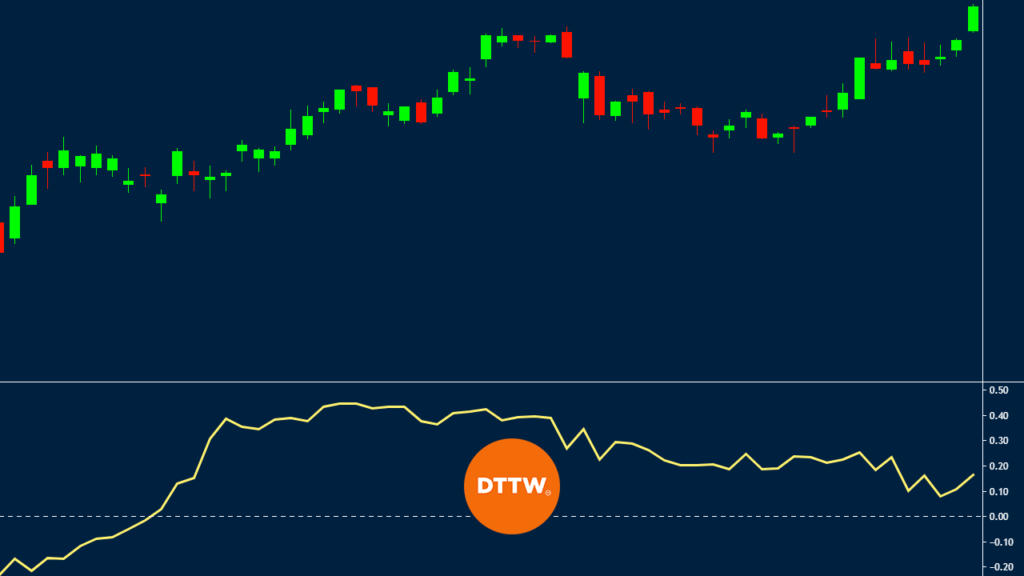
Like the MACD, it is possible to use the CMF indicator in trend-following. Trend-following is a strategy where a trader buys an asset that is already rising or shorts one that is already falling. The goal is to hold that position until it starts to reverse.
One of the approaches to doing this is to find an existing trend, initiate a trade, and then exit it when the CMF indicator starts to reverse.
The challenge with using CMF in trend-following is that it often sends the wrong signals. Therefore, we recommend using it in combination with other trend indicators like moving averages and Bollinger Bands. A good example of the MFI used in trend-following is shown below.

Reversals
A reversal is a situation where an asset moving in a trend reverses and starts a new one. This strategy is similar to trend-following, with the only difference being that trend-followers aim to buy into an existing trend.
Reversal traders, on the other hand, aim to get into a trend earlier on. The best way to use the Chaikin Money Flow indicator is to buy when it moves to an extremely low level. You can also short an asset when it moves to an extremely higher level.
Looking at the neutral line will help you trade reversals. A buy trade is confirmed when the indicator moves above the neutral line.
Divergences
It is possible to use the Chaikin Money Flow index to trade divergences. A divergence is a situation where an asset price is rising while the oscillator is moving in the opposite direction.
When this situation forms, it is usually a sign that the price is about to change direction. A good example of this is shown below.
Cons of using the Chaikin Money Flow indicator
- It is not ideal to use it alone because of the many false signals.
- It does not factor in the market sentiment.
- It cannot be used in highly-volatile and ranging markets.
Summary
The Chaikin movement flow indicator is a relatively uncommon indicator. Not so much trader use it on a daily basis. Yet, it is a great indicator you can use to complement other indicators. It is also a good indicator you can use to identify divergencies and reversals.
External Useful Resources
- The Difference Between Chaikin Money Flow (CMF) and Money Flow Index (MFI) – Investopedia
- Chaikin Indicator in Tradingview Wiki

