

Day traders use several approaches to find buying and selling opportunities. Some of the most popular ones are arbitrage, scalping, momentum or trend-following, and news trading.
While these strategies are different, a key similarity is that they all focus on identifying support and resistance (S&R) levels. In this article, we will look at some of the best S&R indicators to use.
Table of Contents
What are support and resistance levels?
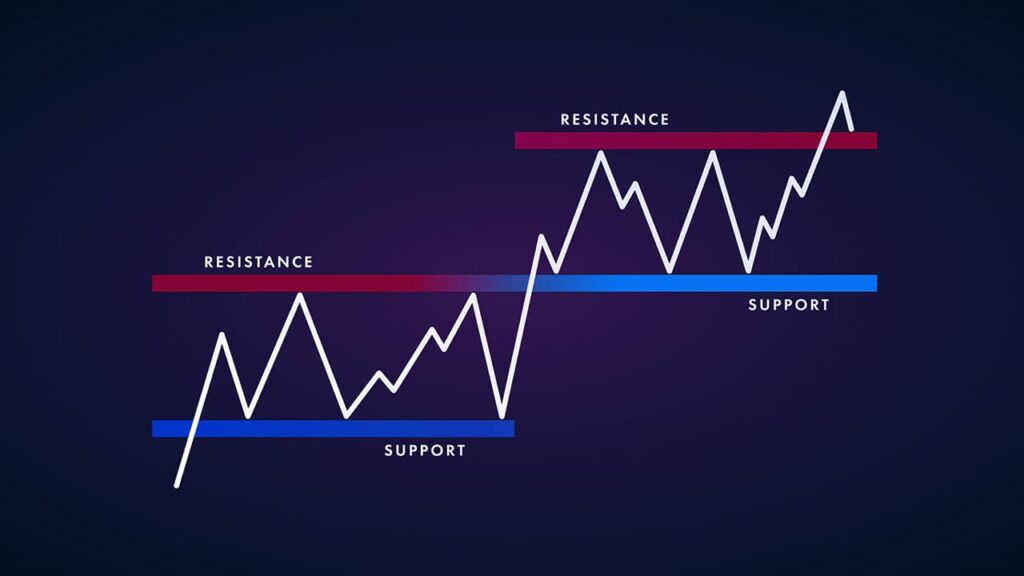
S&R are important levels where financial assets like stocks, commodities, and forex pairs struggle to move above or below. These levels are created because of the psychological state of market participants.
A support is a level where financial assets struggle to move below while a resistance is a price where they find it difficult to move above. In simpler terms, a support is seen as a floor while a resistance is a ceiling.
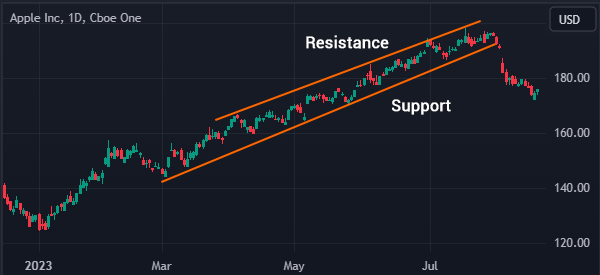
S&R levels can be drawn horizontally or diagonally. The chart below shows the S&R levels drawn in a diagonal way.
As you can see, Apple shares are finding it difficult to move above the resistance. They then made a strong bearish breakout when they moved below the support level.
Benefits of identifying support and resistance
There are several benefits of identifying S&R levels when day trading. Some of these advantages are:
Identifying buying or shorting points
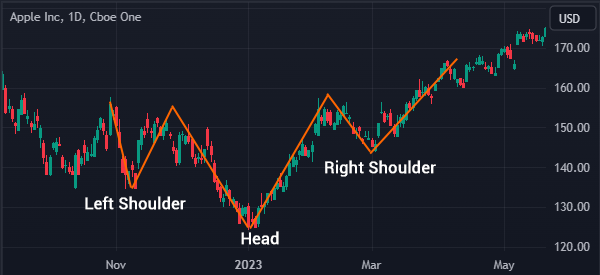
The first benefit of identifying S&R positions is that they help you identify the points to buy or sell financial assets. A good example of this is in the chart below.
As you can see, the shares formed an inverted head and shoulders (H&S) pattern whose neckline (or resistance) was at $155.78.
In price action analysis, this is one of the best-performing bullish patterns. Therefore, a trader would have placed a bullish trade above this resistance.
Identifying areas to place stop-loss and take-profits
Risk management is an important part of the market since it lets you maximize your profit potential while limiting the downside risks. All successful traders use risk management strategies. Two of the most popular are stop-loss and a take-profit.
A stop-loss is a tool that stops a trade automatically when it reaches a preset loss level. On the other hand, a take-profit stops it when it hits a pre-set profit level. One way of placing these stops is to use the support and resistance points.
Identify invalidation points
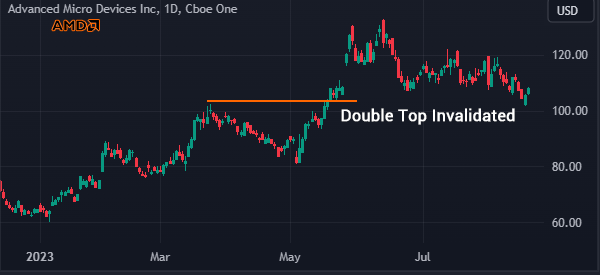
An invalidation level is a price where a trading thesis becomes invalid. For example, in the chart below, we see that AMD stock was forming a double-top pattern at $102.76.
In price action analysis, this pattern is usually followed by a bearish breakout. However, a move above the upper part (or the resistance) is seen as an invalidation point.
Top performing support and resistance indicators
Day traders use several indicators to identify support and resistance levels. Let’s go over what we think are the best ones for this task.
Moving averages
Moving averages (MA) are indicators that attempt to find the mean price of an asset over time. The main approach for calculating moving averages is to add the prices and then divide by the number of days. There are several types of MAs, including simple, exponential, weighted, smoothed, and volume-weighted.
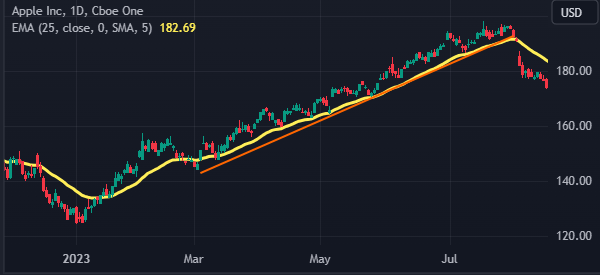
The best way to use moving averages is to find a good period and then apply it on a chart. In the chart below, we have applied the 25-day MA on the Apple chart.
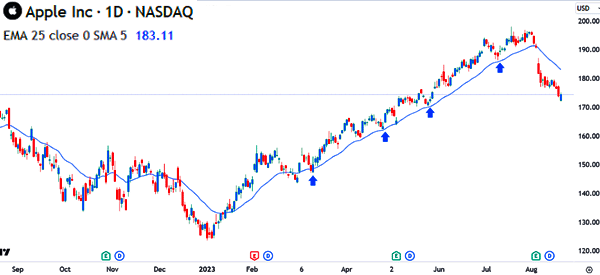
As you can see, this average provided an important support. A move below that level confirmed a bearish breakout.
Bollinger Bands
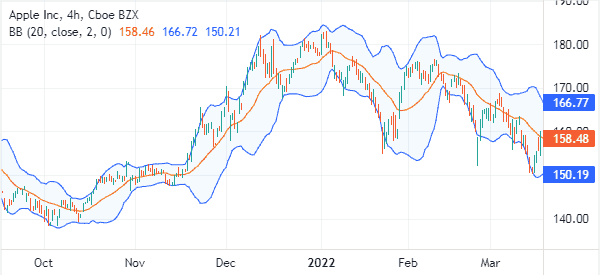
Another support and resistance indicator is known as the Bollinger Bands. It is made up of three lines, with the middle one being the moving average and the two others being the standard deviations. Traders often use these lines to identify S&R levels, with the lower line being the resistance.
In the chart below, the shares remained in an uptrend when it was above the middle line. The upper side was the resistance while the lower side is the support. In this case, a trader can place the stop-loss at the lower side of the bands.
Donchian channels
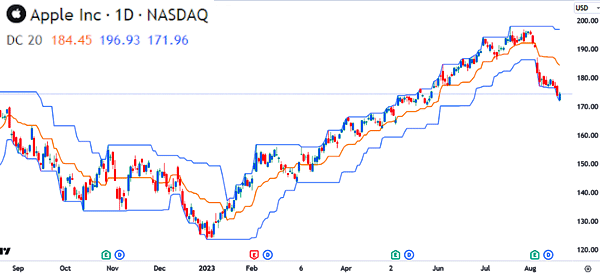
Donchian channels have a close resemblance to Bollinger Bands but they are created differently. Whereas the two outer lines in BB are the standard deviation, those in Donchian Channels are the highest and lowest levels in the previous sessions. The middle line is calculated by adding the value of the upper and lower sides and then dividing them by 2.
While the two indicators are different, they are used in the same manner to identify support and resistance levels. Below is a chart with the Donchian channels.
Fibonacci Retracement
Fibonacci Retracement is not necessarily an indicator. Instead, it is a charting tool that traders use to identify key levels in a chart. It was developed using concepts of the Fibonacci sequence. It is applied in a chart by connecting the highest and lowest swings.
Once applied, the tool has several important Fibonacci levels like 23.6%, 38.2%, 50%, 61.8%, and 78.6%. Each of these levels is seen as a crucial support or resistance point.
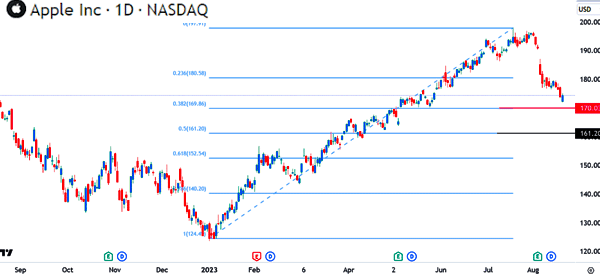
For example, in the chart below, we have connected the lowest point in 2023 and the highest level during the year. The stock has dropped below the 23.6% retracement point and is approaching the 38.2% point.
In this case, the latter is an important level of support. A break below that level means that the shares will likely continue dropping to the 50% retracement point at $161.20.
Pivot points
Pivot points are tools that are used to identify support and resistance levels. There are several types of these points, including:
- Traditional
- Fibonacci
- Woodie
- Camarilla
- Classic
based on how they are calculated. For example, the standard pivot point is calculated using the following formula:
Pivot point (P) = (High + Low + Close) / 3
Support 1 = (P x 2) – HIgh
Support 2 = (P – (High – Low)
Resistance 1 = (P x 2) – Low
Resistance 2 = P + (High – Low)
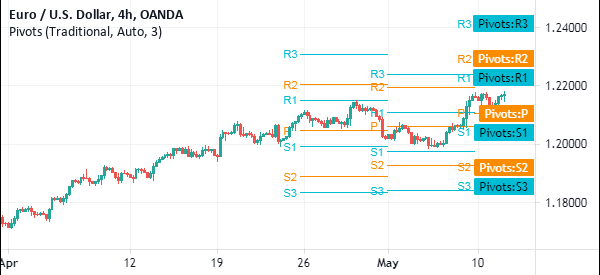
The simplest way to apply the pivot points is to find them using the indicator window of TradingView. The chart below shows the pivot points applied on.
Murrey Math Lines
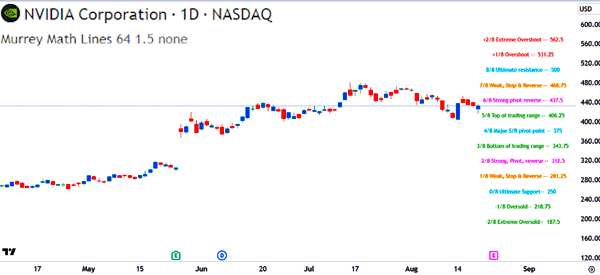
The other popular charting tools used to find support and resistance levels. They are calculated by dividing the chart into several 1/8th levels.
These levels are then indicated as extreme overshoot, overshoot, ultimate resistance, weak, stop & resistance, strong pivot resistance, and top of trading range among others, as shown below.
Support and resistance strategies
There are three primary strategies for using the S&R levels: breakout, channel, trend, and reversals. Let’s break them down in more detail.
Breakouts
A breakout happens when an asset moves above a resistance level. In this case, the thinking is that the price will continue moving in that direction.
Another breakout strategy is where an asset moves above the resistance and then retests it. If this happens, the view is that the price will continue rising.
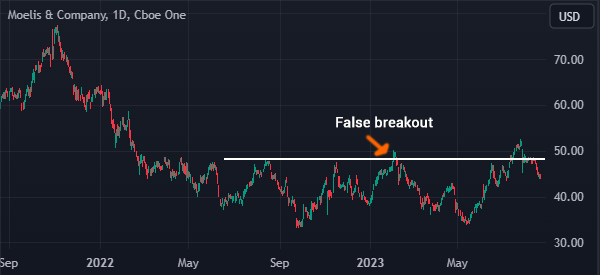
Another approach of breakouts is known as a false breakout. This is where the price moves above a resistance point and instead of continuing the uptrend, it resumes the bearish trend, as shown below.
Channel strategy
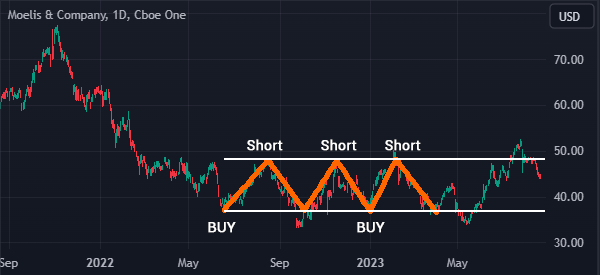
Another S&R trading strategy is known as the channels. It is where you buy when the price moves to the support and then short it when it moves to the resistance. At times, it is possible to do this several times as shown below.
Reversals
A reversal is a period when an asset moving in an upward or downward trend changes direction. In this case, you can use support and resistance levels like the Fibonacci retracement or trendlines to verify the reversal.
The chart below shows that the Apple shares made a reversal when it dropped below the ascending trendline and the 25-day moving average.
Summary
After we have clarified the concept of Support & Resistance for you, it is clear why we have decided to cover the best indicators (and tools) available to traders.
But knowing which tools we have at our disposal is not enough! We must also have a clear strategy in mind on which we can apply them.
External useful resources
- How To Trade Dynamic Support & Resistance Indicators – 2ndskiesforex

