

Day traders and investors use numerous tools to determine whether to buy or sell financial assets like stocks, commodities, cryptocurrencies, and forex. They use technical indicators and other specific tools to also determine their entry and exit points.
In this article, we will look at the Fibonacci Retracement indicator and how to use it in the market, going into the best strategies in which this tool can be a game changer.
Table of Contents
What is the Fibonacci sequence?
The concept of the Fibonacci Retracement tool is based on the Fibonacci sequence. For starters, the Fibonacci sequence was discovered many years ago to explain a series of how numbers follow each other.
The sequence works by adding the two numbers before it. The first number in this case is 0 while the next one is 1, followed by 1. Therefore, in this case, the first few numbers of the sequence are:
| 0,1,1,2,3,5,8,… |
In this case, the next number in this sequence is 13 (8+5) while the next one is 21 (13+8).
Therefore, the rule of the Fibonacci sequence is:
| Xn = Xn-1 + Xn-2 |
In this case, Xn is the number “n” while Xn-1 is the previous term (n-1) while Xn-2 is the number before that (n-2). A good example is term 9, which is calculated as:
| Xn = X9-1 + X9-2 |
| = X8 + X7 |
| = 21+13 = 34 |
What is the Fibonacci Retracement?
The Fibonacci Retracement is a tool using the same principles as the Fibonacci sequence. In this case, this tool uses several numbers in the sequence.
The main Fibonacci sequence numbers in the sequence are 23.6%, 38.2%, 61.8%, 78.6%, and 100%. While the 50% figure is placed in the retracement, the number is usually included to show the neutral point.
The Fibonacci Retracement tool is not an indicator. Instead, it is a mathematical tool that traders and investors use to identify potential support and resistance levels.
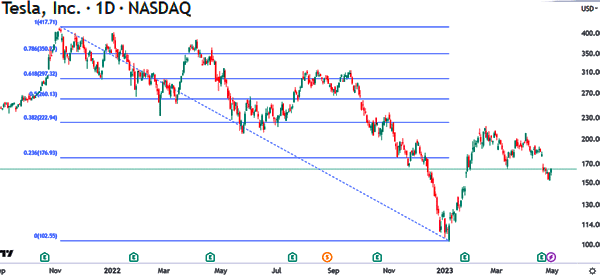
It is also used to identify potential areas of pullbacks and continuations. The chart below shows the Fibonacci retracement tool applied on the Tesla chart.
Fibonacci extension
The most popular tool in this is known as the Fibonacci retracement. However, many people still use another tool known as the Fibonacci extension.
The extension is used to predict the next key levels to watch in the future if the price moves above the upper or lower sides of the initial tool. The figures of the extension are typically 1.61, 1.50, 1.38, and 1.23 among others.
Why use the Fibonacci retracement?
There are several reasons why traders and investors use the Fibonacci retracement. Here are the most relevant reasons why these people use the Fibonacci retracement tools.
To identify support and resistance
The most popular reason why people use the Fibonacci retracement is to identify support and resistance levels. Support is defined as an area where the price struggles to move below. It is often seen as an asset’s floor.
On the other hand, resistance is defined as a ceiling where an asset struggles to move above. As such, it is often seen as a ceiling.
These are the two most important levels that a trader uses to operate in the markets. In the chart below, we see that the stock found a strong resistance at ~$257, which was the 50% Fibonacci retracement level.
To identify areas of potential breakouts
The other approach is to use the tool to identify breakouts. A breakout is a price where an asset suddenly rises or falls out of a range.
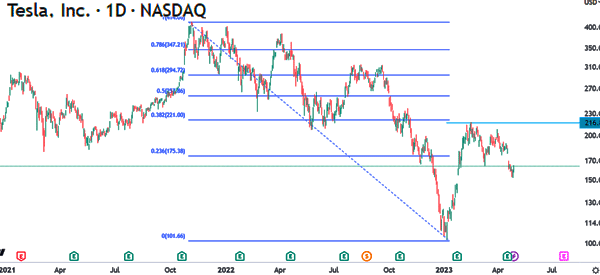
In the example above, a bullish breakout would be confirmed if the price moves above the 50% retracement level. If this happens, it means that the price will likely continue rising as buyers target the 61.8% retracement level at $295.
To identify stop-loss and take-profit levels
The next main reason why traders use the Fibonacci retracement tool is to identify the stop-loss and take-profits. In most periods, traders place their stop-loss and take-profit slightly above or below the key retracement levels.
Fibonacci retracement strategies
After having seen what are the best uses for the Fibonacci retracement tool, let’s go ahead and check out what strategies it can be used in.
Using Fibonacci retracement in trend following
Trend-following is a trading strategy where a trader aims to buy and hold an asset as its price continues rising. In the same period, it involves shorting and holding the asset as it continues falling.
In trend-following, the Fibonacci retracement can help you identify when there are pullbacks where you should buy the dip and the vice versa.
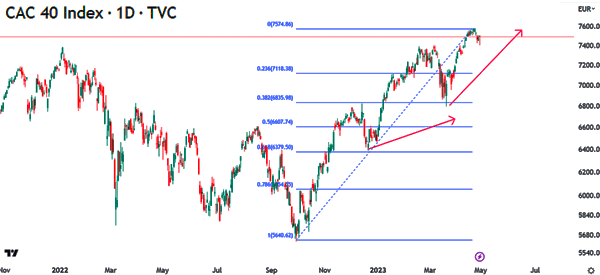
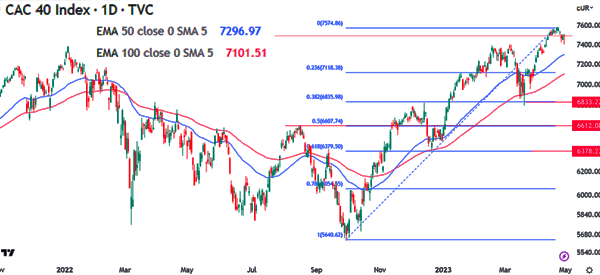
A good example of this is shown below. As you can see, the CAC 40 index is rising when it pulls back to 6,824 (38.2% Fibonacci retracement) and then resume the uptrend.
Using Fibonacci to trade reversals
A reversal is an important concept in trend-following. It happens when an existing trend fades and then a new one starts. In most periods, all trends usually end with a reversal. Traders use several tools to know how to identify reversal points.
For example, they use the moving average crossover like the golden cross to identify these reversals. They also use the Fibonacci Retracement tool. For example, in the chart below, we see that the CAC index made a bullish crossover. The bullish breakout was confirmed when the price moved above the 50% Fibonacci Retracement level at 6,612.

Place stop-loss and take-profits
The other approach for using the Fibonacci retracement tool is to place a stop-loss and a take-profit. In the example below, suppose you bought the CAC 40 index at the 50% retracement level at 6,612.
In this case, you could place a take-profit at the 61.8% retracement point at 6,800 and a stop-loss at 6,400. If the trade works out fine, the take-profit at 6,833 will be triggered while a stop-loss at 6,378 will be triggered if the trade fails.
Using the Fibonacci Retracement for psychological levels
The other approach for using the Fibonacci retracement is to identify psychological levels in an asset A psychological level is a price where an asset behaves in a unique way. In most cases, the most psychological levels are usually even numbers like 100, 20, and 30. In many cases, traders use these Fibonacci retracement levels as psychological points.
Combining Fibonacci with other tools
The reality of Fibonacci retracement is that it is almost impossible to use it alone. Therefore traders use it in a combination with other tools. The most popular tools that traders use when using the tool are indicators like the moving average and the Relative Strength Index (RSI) and the MACD.
Traders also use several approaches like candlestick patterns like head and shoulders and rising wedge patterns to predict the next movements in an asset. Further, traders also combine it with tools like Andrews Pitchfork. Gann Fann, and Fib Circles among others.
Summary
The Fibonacci Retracement is an important tool that makes it possible for traders to identify key support and resistance levels. It also serves numerous roles in the financial market such as identifying stop-loss and take-profit levels and psychological points.

