

Deciding on when and where to enter or exit a trade is a crucial component of any forex trading strategy. The task tends to be challenging for experienced and novice traders alike.
To begin with, there are numerous elements that influence the direction of the market. Besides, the market trends are constantly shifting.
As such, hesitating to enter or exit a trade by even a minute may reduce your potential profits or increase your risk of incurring losses. In this article, we will focus on how to identify entry points in trading.
Related » When to enter and/or exit a trade?
Table of Contents
Why it’s important to find good entry points
The toughest task for any trader is to determine the best entry place. If it was an easy task, most people would be successful in the industry. Instead, finding these entry points is highly tough.
Some of the top reasons for determining the best entry points in the market are:
- Maximize profits – The most important reason why identifying entry points is to maximize your profits. The best entry point of any trade is when a new rally is about to start.
- Avoid false breakouts – A false breakout is a situation where an asset moves above a consolidation level and then declines sharply afterward.
- Take advantage of major themes – You should find a good entry point to take advantage of long-term themes.
These are all great reasons to constantly (almost in a loop) optimize your entry points. Spoiler: you don’t have to enter every trade. If you feel you haven’t spotted any good entry points, just wait.
Conduct a Detailed Fundamental Analysis
Whether you intend to trade shares, currencies, commodities, or indices, fundamental analysis is a crucial strategy in identifying an entry level.
While the aspects to look out for depend on what you intend to trade, the purpose of a fundamental analysis is to evaluate the asset’s intrinsic value.
Ratios
For instance, if you are looking for an entry point in a stock trade, start by evaluating the company’s financial ratios.
The ratios to evaluate include the PBV (Price to Book Value) ratio, PE (Price to Earnings) ratio, dividend yield, and its current ratio.
Financial reports & competitors
Next, look at the firm’s financial reports, its competitors, and future prospects. In the case of forex trading, your fundamental analysis should focus on economic indicators that can influence the movement of a particular currency.
Numbers such a country’s GDP, industrial production, retail sales, purchasing managers index (PMI), consumer price index (CPI), and employment data will come in handy.
Perform a Technical Analysis
In trading, a technical analysis utilizes relevant statistics and price charts. Studying the prior market patterns will help you make an accurate prediction of the future price trends.
The main advantage of technical analysis is that it offers reliable signals for price movements; a component that is effective in any trading strategy.
While the technical analysis is an efficient approach of determining your entry point in a trade, it is important to note that the approach is not 100% accurate.
How to reduce the margin of error
There are certain aspects of the market that are unpredictable. As part of your risk management strategy, use several analysis tools and indicators.
Some of the reliable tools for the technical analysis include:
- Support and resistance levels
- Fibonacci retracement
- Relative Strength Index (RSI)
- Exponential Moving Averages (EMAs)
As for the latter analysis tool, you can use about two versions such as the 50-day and 100-day EMAs.
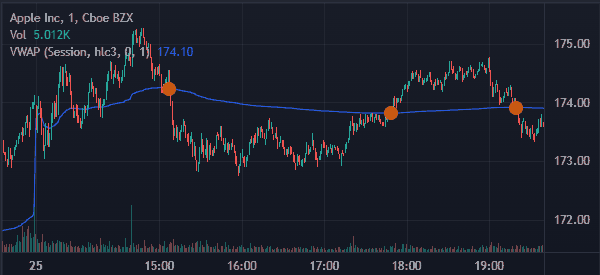
These indicators help traders to decide where to buy and sell. A good example of this is the VWAP indicator that is shown below. In this case, a bullish trade should be executed when the asset moves above the VWAP indicator.
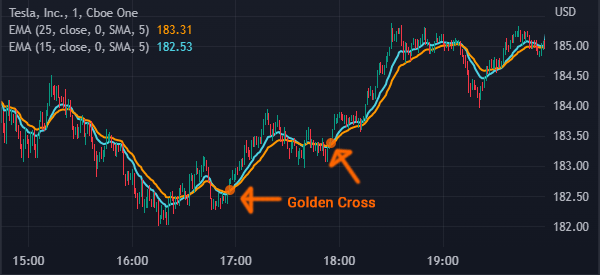
Another way of using technical indicators is using trend indicators like moving averages. For example, a golden cross happens when the 200-day and 50-day moving averages make a crossover. For day traders, they usually adjust the period to about 20 and 10.
Look Out for Psychological Levels
In trading, psychological levels are price points that appear in the form of round numbers. It may be the likes of 1350, 1200, or 200.
These figures tend to influence the support and resistance levels in the market. Based on the fact that humans are attracted to simplicity, traders often value whole numbers.
Incorporating this concept in your technical analysis will be helpful in identifying the ideal entry points in a trade.
Price Action Should be Part of Your Analysis
Simply put, price action refers to the movement of price over a certain period of time. It forms the foundation of an asset’s technical analysis. By using an apt price action strategy, you will accurately interpret reversals, breakouts, and other market trends.
There are various tools that one can include in a price action strategy. Some of the simple ones are bullish and bearish pennants/flags, hammer, wedge, or the head and shoulder patterns.
Continuation and reversal
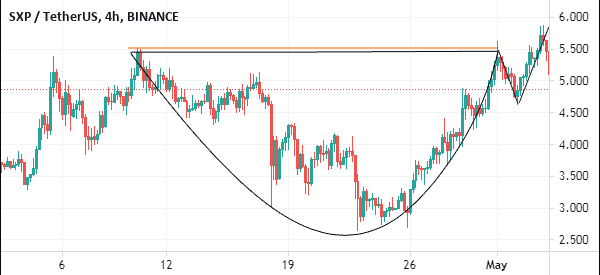
There are two main types of price action patterns: continuation and reversal patterns. Continuation patterns include bullish and bearish pennants and flags and ascending, cup and handle, and descending triangles.
When these patterns happen, it is usually a sign that a trend will continue. A good example of a cup and handle pattern is shown in the chart below.
Examples of popular reversal patterns in the market include double top and bottom, rising and falling wedges, and head and shoulders among others. When these patterns form, it is usually a sign that the price will change direction in the near or long term.
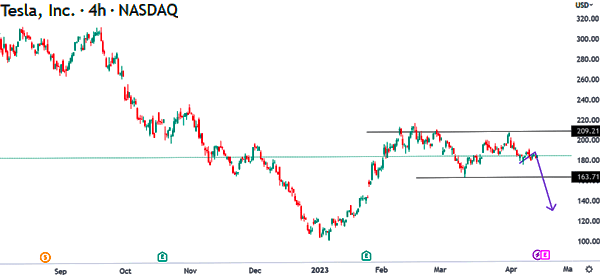
The chart below shows that Tesla shares have formed a double-top pattern at about $209. Its neckline is at $163, signaling that the stock will likely have a bearish breakout. Therefore, in this case, the best place to place a short trade is at $155, which is below the neckline.
In addition to these patterns, there are other candlestick patterns that one can use in the market. They include doji, hammer, morning star, and evening star.
Final Thoughts
Just like exiting a trade, entering the market should be a calculated move. The strategic entry into a trade increases your potential profits while lessening the probable risks.
All the aspects included in this article are crucial in determining when and where to enter a trade. However, it is important to note that the market prices and trends change in minutes or even seconds.
As such, time is of the essence. Conduct your fundamental and technical analysis promptly yet comprehensively!
Additionally, consistently following the relevant news will help you understand the market.
External Useful Resources
- Find Your Forex Entry Point: 3 Strategies To Try – DailyFx
- Mapping Out an Entry and Exit Plan – TDAmeritrade

