Reversals are essential components when trading stocks, currencies, bonds, and all other assets in the financial market. They happen when the price of an asset suddenly pulls back from its previous upward or downward rally.
In this report, we will look at how you can identify and trade reversal patterns successfully.
Table of Contents
What is a reversal?
A reversal is a situation where a financial asset changes its direction. It happens when a stock that is rising suddenly changes direction. For example, if a stock is rising, a reversal happens when it suddenly moves downwards. A good example of this reversal is shown below.
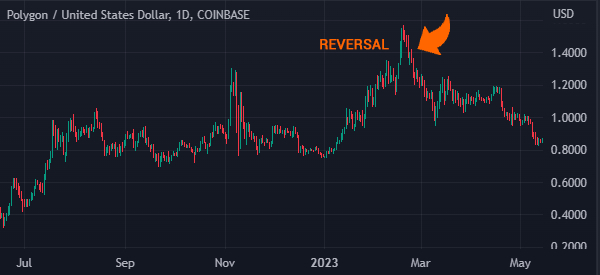
A reversal, when caught right, is one of the best strategies to trade since it allows you to catch a new trend early.
However, as shown below, these reversals are usually not easy to catch. If they were, most people would be excellent traders. Instead, most people who start trading fail.
Bullish vs bearish reversal
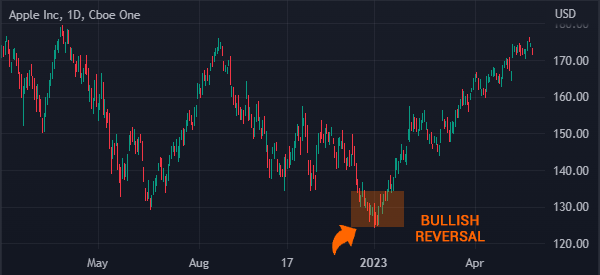
There are two types of reversals in the market. A bullish reversal pattern happens when a descending asset changes its direction and turns bullish. On the other hand, a bearish reversal pattern happens when an asset that is rising changes direction.
A good example of this is shown in the chart above. The chart below, on the other hand, shows a bullish reversal pattern.
What causes reversals?
There are several reasons why reversals happen in the financial market.
The Asset is Overbought
First, they happen when a rally gets extremely overbought. This happens when the price of an asset moves up too fast, causing existing investors to start panicking.
As a result, some start to sell their positions, leading to a reversal pattern.
Major News
Second, reversals happen when there is a major news that affects a certain asset. Examples of these news are related to politics, economic data, and financial release. For example, a company’s stock can reverse if it reports weak financial results.
Similarly, a currency pair can drop when a country releases weak or strong economic numbers like manufacturing PMIs and retail sales.
Technological/Technical Factors
Third, reversals can happen because of technological factors. In some cases, a technological aspect in the broker’s back end can lead to a sharp decline of a financial asset.
Finally, a reversal can happen because of technical reasons. For example, the price of an asset can reverse when a certain technical level is reached.
How to trade reversal patterns: essential steps
Identify the cause of the reversal
The first thing you need to do is to identify the cause of the reversal. The goal for doing this is to identify whether the reversal will continue for a long time or whether it is just temporary.
For example, as shown below, the US dollar index formed a sharp and long-term reversal during the pandemic when the Federal Reserve slashed interest rates. It also launched its biggest quantitative easing program ever.
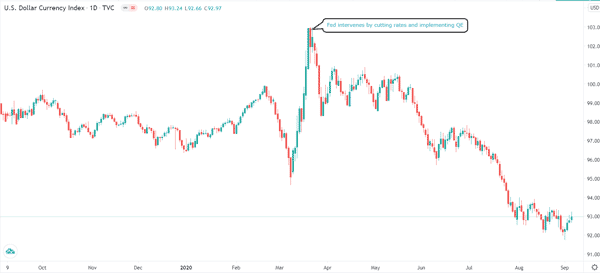
As mentioned above, other causes of these trend reversals are company earnings, an analyst upgrade or downgrade, economic data, a geopolitical event, and even a major announcement by a company.
Identify key support levels
The next step is for you to do when trading reversal patterns is to identify the key support levels. For starters, a support is usually a level where the price of an asset finds strong challenge going below. Its opposite is the resistance level.
These levels can help you know whether the price of an asset will continue falling or whether the reversal will be short-lived.
There are several approaches to identifying these support levels. First, you can identify the key psychological levels such as even numbers.
For example, if the stock drops from $120 to $100, the latter is a good psychological level. Essentially, if the price drops below $100, it could mean that bears have prevailed and that it will attempt to retest the next psychological level at $90.
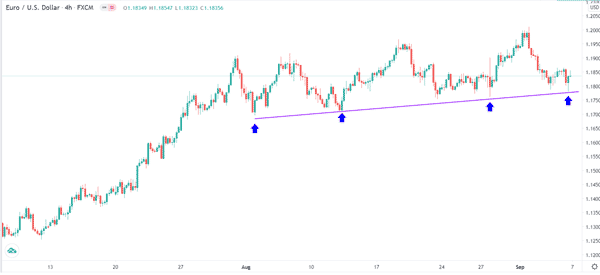
Second, you can connect key levels to find your support level. A good example of this is in the four-hour EUR/USD pair below.
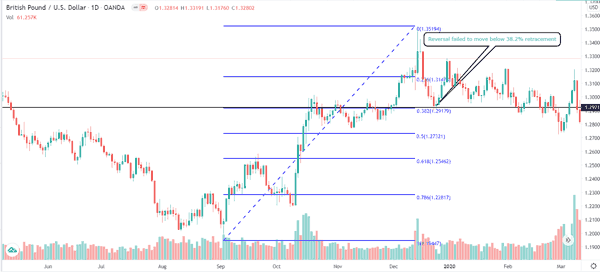
Another way to identify key support levels is to use the Fibonacci Retracement tool. You draw this by connecting the lowest and highest levels and identifying key points.
For example, the chart below shows that the GBP/USD pair failed to move below the 38.2% Fibonacci retracement level.
Set key stops
Ideally, you want to short an asset whose price has just reversed. However, it is important for you to set key stops to avoid a false breakout. This happens when the price of an asset slips, reaches a key level, and then resumes the previous trend.
A good way to do this is to check out the overall trend. If you are using short-term timelines like 30-minute, you need to check the daily chart to see whether it too is reversing.
Strategies to trade reversals
As mentioned above, there are several strategies to trade reversals. Some of these strategies are:
Using technical indicators
The first approach is to use technical indicators to trade reversals. There are several strategies to do that. For example, one can use oscillators like the Relative Strength Index (RSI) and Stochastic Oscillator to find overbought and oversold levels.
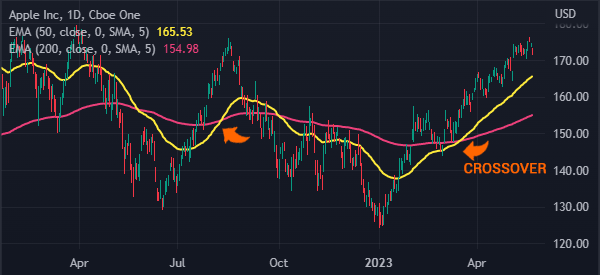
Also, you can use trending indicators like moving averages to trade these reversals. A good example of this is shown in the chart below. The chart shows that a bullish reversal was confirmed when the 50-day and 200-day moving averages made a bullish crossover.
Using chart patterns
The other approach to trade reversals is to use chart and candlestick patterns. Examples of popular reversal chart patterns are:
- Head and shoulders
- Double-top and double bottom
- Rising and falling wedge
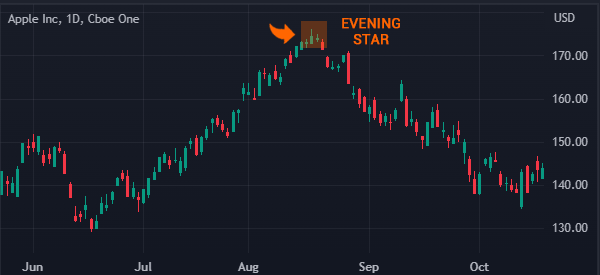
Candlestick patterns that signal a potential reversal are hammer, morning and evening star, and bullish engulfing among others.
A good example of this is shown in the chart below. The reversal happened when the stock formed an evening star pattern.
Trendlines
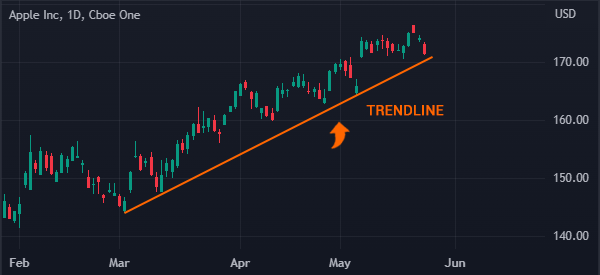
Another strategy to use is the use of trendlines. A trendline is a line that connects several low or upper levels of an asset.
A bearish reversal is confirmed if the price moves below the trendline. As shown below, Apple has formed an ascending trendline. In this case, a reversal would be confirmed if the price moves below the ascending trendline.
Fibonacci Retracement
The other way to trade revesals is to use tools like the Fibonacci Retracement. Fibonacci Retracement is a tool that uses the Fibonacci sequence. It is used by linking the upper and lower sides of a chart.
Therefore, a reversal is confirmed when the price moves below or above a certain Fibonacci level. For example, a bullish reversal can be confirmed if it moves above the 38.2% retracement level.
Key Takeaway
Reversals are very important aspects when you are trading in the financial market. Ideally, a reversal can be the start of a long-term trend. Alternatively, it can also be a short-term rebalancing of an asset whose price then resumes its previous trend.
As such, having a good understanding about how they work and how to trade them will help you identify entry levels and avoid making mistakes.
External Useful Resources
- How to Identify Reversals in Forex – Babypips


