

Reversals refer to periods when an asset’s price changes direction and starts a new trend. It is one of the most useful trading techniques in the financial market, used by both long-term and short-term traders. It is also an ideal trading approach by trend-following traders.
Finding reversals can be a difficult thing for all types of traders. In fact, if it was easy, most people would be making a lot of money in the market. In reality, most statistics show that more than 80% of traders in the market tends to lose money.
Table of Contents
How to trade reversals
You can use this our previous article for a comprehensive guide on how to trade reversals in the market.
Traders use different types of tools to find reversals. There are those who specialize in using technical tools like indicators. Others use their own judgement to predict when a reversal is about to happen. A large group of these traders use price action trading patterns like triangles, hammer, hanging man, head and shoulders, and wedges to determine when an inversion is about to happen.
In this article, we will look at the best reversal indicators you can use in the market.
» Related: The Best Trend Indicators
The most accurate reversal indicators to choose from
Moving averages (MAs)
MAs are some of the best trading indicators in the market. In fact, a large number of indicators like the Donchian channels and Bollinger Bands originate from the moving averages.
There are several types of moving averages, including simple, exponential, weighted, volume-weighted, and smoothed. Essentially, all these types of MAs work in a similar manner. Their goal is to remove the noise presented in the normal MA.
For example, while the SMA takes all periods the same, the exponential moving average puts more weight on recent data.
There are several ways of using MAs to find reversals.
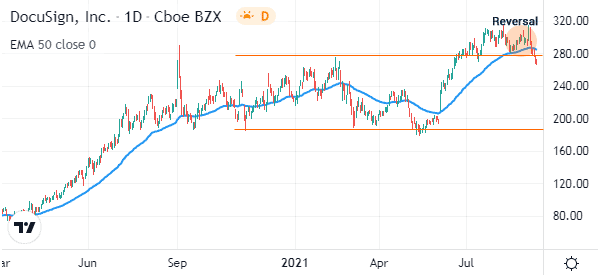
The most common one is to place a MA of your choice on a chart. The reversal (bullish) will be confirmed when the price moves below the moving average. In case of a bearish trend, the reversal will be confirmed if it moves above the MA.
You can see a good example in the DocuSign chart below.
Bollinger Bands
Bollinger Bands is a technical indicator derived from moving averages and standard deviation. It has three lines, with the middle line being the moving average. The two outer lines are usually the standard deviations of the asset.
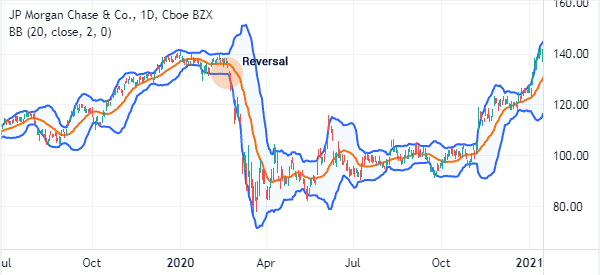
Bollinger Bands are usually trend indicators. A bullish trend is usually confirmed when the price remains between the middle and upper lines of the Bollinger Bands. Similarly, a bearish trend is verified when the price remains between or along the lower lines of the bands.
Therefore, signs of a reversal emerge when the price moves below the middle line. A good example of this in the JP Morgan chart below.
MACD
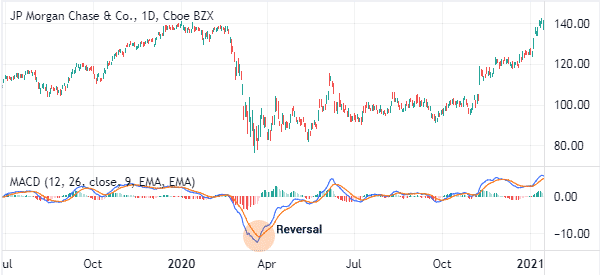
The Moving Average Convergence and Divergence (MACD) is an oscillator that is developed from two moving averages. When applied in a chart, it usually moves to the lower panel. The indicator can be used in both trend trading and also reversals.
A reversal in a MACD happens when the two moving averages make a crossover. The confirmation happens when the two lines maintain a bearish trend. It gets more clearer when the indicator moves below the neutral line.
Take a look of this set-up in the chart below.
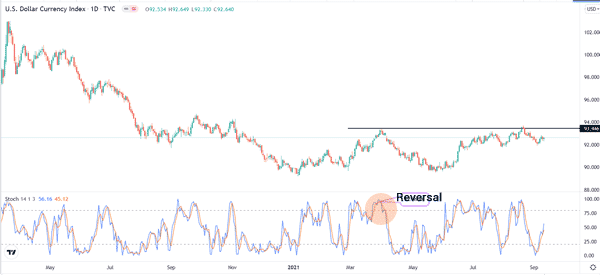
Stochastic oscillator
The Stochastic Oscillator is a tool that is mostly used to find overbought and oversold levels. The indicator usually has two lines known as %K and %D. It is also characterized by two levels known as overbought and oversold levels. This indicator is known for following the speed or the momentum of the price.
It is used to find reversals in various ways such as bullish and bearish divergences. It can also find reversals when it moves to overbought and oversold levels. Still, the indicator tends to show some false signals.
Therefore, you should use it carefully and together with other indicators.
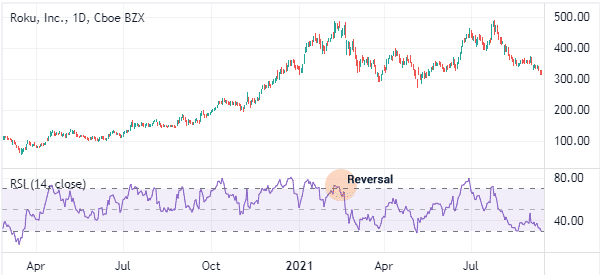
Relative Strength Index (RSI)
The Relative Strength Index (RSI) is another popular reversal indicator. The indicator usually measures the magnitude of recent price changes. Like other momentum indicators, it is popular used to find overbought and oversold levels in trading.
You can use the RSI to find reversals when it gets to extreme overbought and oversold levels. By default, the two levels are usually at 70 and 30. Therefore, when a price moves to an extreme level like 90 and 10, it is a sign that the price will reverse.
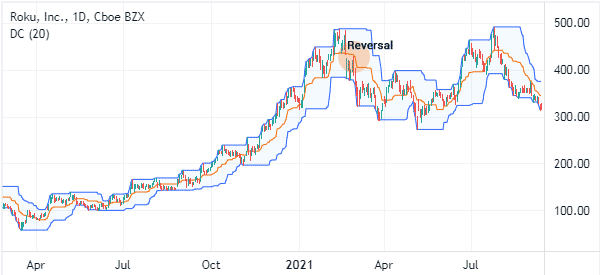
Donchian Channels
Donchian Channels is an indicator that has a close visual resemblance to the Bollinger Bands. But the two indicators are usually created differently. While Bollinger Bands are made up of a moving average and standard deviations, the Donchian Channels is made up a moving average and the highest and lowest levels in a period.
For example, if you are using the 25-day Donchian channels, the upper and lower lines will be the highest and lowest points in that period.
Still, you can find reversals in a similar method. In most cases, a bearish reversal is confirmed when an asset’s price moves below the middle line. A bullish reversal is then confirmed when the price moves above the middle line of the Donchian channels.
The chart below shows an example of how to sue Donchian channel to identify a reversal pattern.
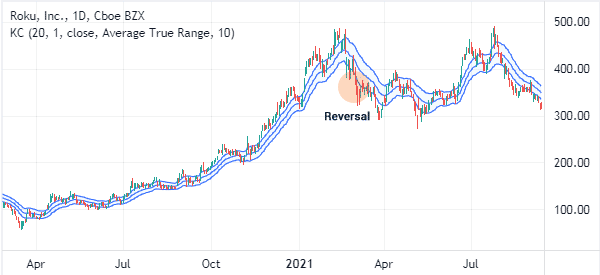
Keltner channel
Keltner channels is other popular indicator that you can use to find reversals. It is a volatility indicator that also has a close resemblance to the Bollinger Bands and Donchian channels. The indicator is formed by combining the average true range (ATR) and the standard deviation.
You can use the Keltner channels to find reversals in a relatively simple manner. A bearish reversal happens when the price moves below the three bands, as shown below.
Know Sure Thing
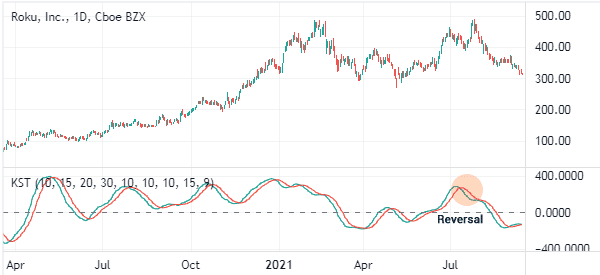
The Know Sure Thing (KST) is an indicator that has a close similarity to the MACD. It is made up of two lines that move up and down. The indicator measures the different price cycles and combines them into a single indicator.
You can use it to find reversals by looking at the change of direction and even finding divergences. The chart below shows the Know Sure Thing used to find a reversal on the Roku stock.
Summary
There are other indicators that you can use to find these reversals. In this article, we have identified eight of the most popular indicators that can help you identify when a reversal is about to take place.
You can also use other tools like Fibonacci Retracement and Andrews Pitchfork to find these periods.
External Useful Reosurces
- Market Reversals and the Sushi Roll Technique – Investopedia

