
As a trader, having a good understanding of technical indicators and how to interpret them is very essential. These indicators help you predict the direction of a financial asset.
There are hundreds of indicators, which you can use in the financial market. One of these indicators is Vortex indicator, which was developed by Etienne Botes and Douglas Siepman.
The two drew inspiration from the work of Alexander Elder, who is one of the best-known authors in forex (and indicators like Elder’s Force).
In this report, we will look at how you can use the indicator in the financial market.
Table of Contents
What is the Vortex Indicator?
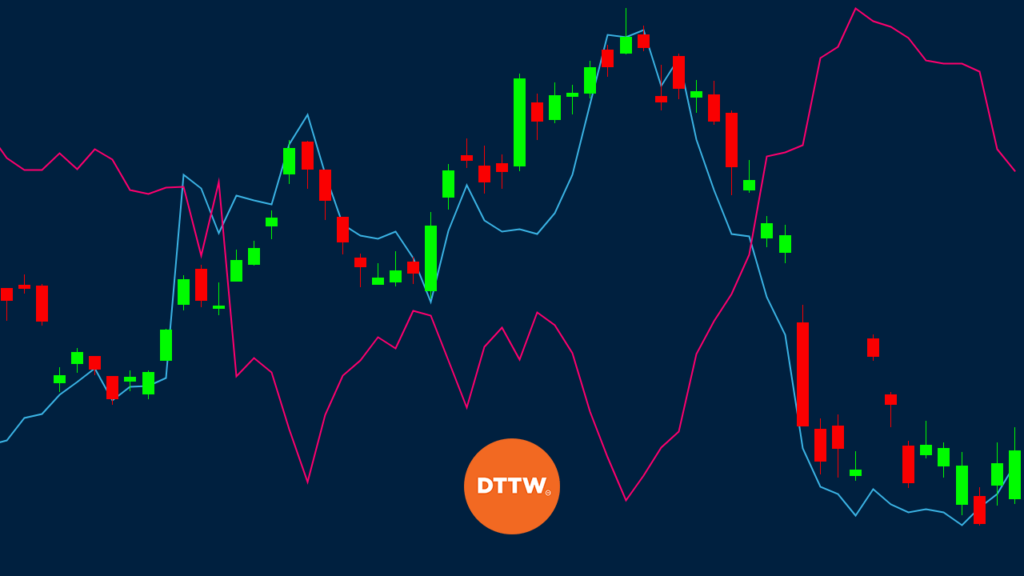
The vortex indicator is a relatively complex indicator that is not very common among retail traders. The indicator has two lines (oscillators) that capture positive and negative trend movements in the market.
The indicator is not installed by default in most trading platforms like the MetaTrader. Instead, you have to manually download and install it.
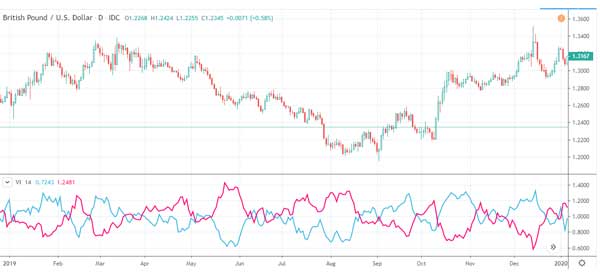
The chart below shows the Vortex indicator applied in the GBP/USD pair. As you can see, the indicator has two lines. The blue line is the positive vortex indicator while the pink line is the negative VI.
This indicator is usually used to confirm current trends or spot trend reversals.
How to Calculate the Vortex Indicator
The calculation of the vortex indicator is relatively complicated. However, as we have written before, these calculations are not necessary for traders. All you need to do is to know how the indicator is interpreted.
In general there are three parts to calculate the Vortex indicator. First, you need to calculate the positive and negative movements on the high and lows of the last two days or periods.
Second, you need to calculate the True Range, which is a concept that was developed by Alex Wilder.
Finally, you need to normalize the positive and negative trend movements by dividing them by the true range.
Vortex Formula
Step 1:
- +VM = Present high less previous low
- -VM = Present low less prior high.
- +VM14 = 14-day sum of +VM
- -VM14 = 14-period sym of -VM
Remember, 14 is the most common period used. Still, you can tweak it to include your preferred period.
Step 2, calculate the true range:
- Current high minus current low
- The same Current high minus previous close
- Current low minus previous close
- True Range (14) = 14-period sum of TR
Step 3: normalize the positive and negative trend movements:
- +VI14 = +VM14/TR14
- -VI14 = -VM14/TR14
As you can see, the process of calculating this information can be difficult but this should not worry you.
How to Set the Indicator
There are few settings when you are using the Vortex Indicator. You can change the length of the period. Most platforms provide this default at 14 and many traders prefer to leave it like that. You can also change the colors of the VI+ and VI- to suit your trading strategy.
How to use the Vortex Indicator in Charts
The first step of using the Vortex indicator is to open and look at the chart. Your goal is to have a visual review of the chart and see how it is moving.
The next step is to look at the Vortex indicator and apply it on the chart. Most importantly, look at the default period used in the indicator. The default period is usually 14 but you can change it to suit your trading strategy.
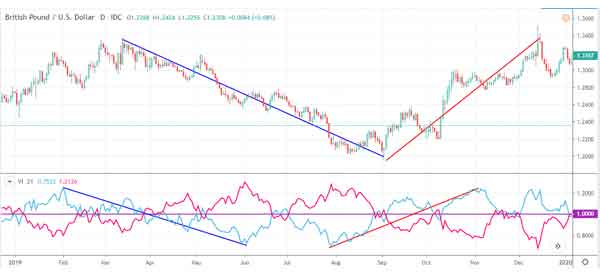
After you apply it, you should draw a horizontal line at 1, which is the middle line. In general, the price will drop when the +VI line is dropping. The price will rise when the +VI line is rising. This is shown in the example below.
You can use the Vortex indicator by itself or in combination with other indicators.
Using the Vortex indicator with other indicators
One of the best approaches for using a technical indicator is to combine it with other indicators. This is an important approach, where a trader adds a few indicators on a chart to confirm a trend.
There are three main types of indicators you can use with the Vortex. First, there are trend indicators like moving average, Bollinger Bands, and Parabolic SAR dots. These indicators are used to identify trends or reversals.
Second, there are oscillators, which are indicators used to identify overbought and oversold levels. These are extreme levels, which are followed by a reversal. Third, there are volume indicators, which are used to analyze trading volumes of an asset.
A good example of this is shown below. In this chart, we see that Tesla shares have continued the bullish trend when the +VI indicator and -VI made a bullish crossover.
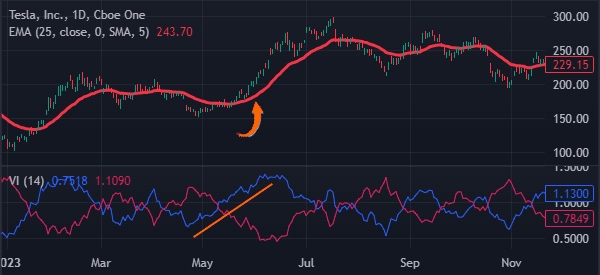
In this case, a trader could have held the trade as long as the price was above the indicator. The other popular indicators you can combine with the Vortex Indicator are the Relative Strength Index (RSI) and MACD.
Vortex indicator crossover
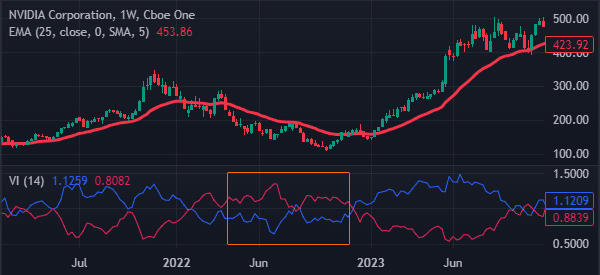
For all oscillators like the Vortex, buy and sell signals emerge when there is a crossover. In this case, you should look at the VI+ and VI- lines and when they cross each other. A good example of this is in the chart below.
As seen, on the weekly chart, the Vortex Oscillator remained in a consolidation between April 2022 and December 2022. The two lines then made a bullish crossover, leading to a strong Nvidia stock rally.
The other approach is to use other indicators like moving averages and Bollinger Bands. In this case, you can use golden cross, which happens when the 50-day and 200-day moving averages cross each other. When it happens, you can confirm this Vortex Indicator to confirm the trend.
Use it as a confirmation signal
The Vortex indicator can be used as a confirmation sign, as We have explained above. You can use it to confirm trades in other indicators like moving averages and Bollinger Bands.
Additionally, you can confirm chart patterns like triangles, rectangles, and head and shoulders patterns.
Advantages of Using the Vortex Indicator
There are several benefits of using the Vortex indicator. First, it is an uncommon indicator. This means that using it will give you an edge against other indicators. Second, the indicator is relatively easy to understand.
Third, the indicator can be used easily with other indicators like the Average True Range (ATR) and MACD.
Cons of using the Vortex Indicator
There are several cons of using the Vortex indicator.
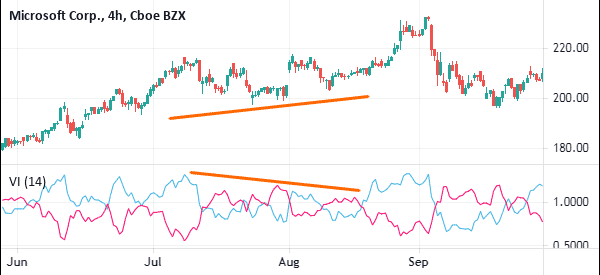
- Wrong signals – The indicator tends to provide the wrong signals, as shown in the Microsoft shares below.
- Not provided in most platforms – The Vortex indicator is not provided in default in most platforms.
Conclusion
In conclusion, the Vortex indicator is an essential indicator that you can use to trade any type of financial securities. The indicator can help you identify where new trends are starting to form and to confirm a trend.
Before you use it, ensure that you study more about it and experiment on the demo account.
External Useful Resources
- How to Catch Profitable Trends with the Vortex Indicator – Dukascopy
- How to draw Vortex in charts – StockCharts

