Alexander Elder is one of the best-known contributors in the forex and financial trading industry. He is an author, inventor, and trader, who has written several best-selling books on forex.
In one of his classics, Trading for a living, Elder introduced the world to the Force Index. In this report, we will look at what the Force Index is and how you can use it to trade in the financial market.
→ Alexander Elder: A Legendary Man in Trading
Table of Contents
What is the Force Index?
In most of his writings, Elder has talked immensely about the three factors he believes are the most important in the market.
First, he has talked about direction. His argument is that the price of an asset will mostly continue moving in the same direction until some important news comes in. As such, he advises against going against the trend.
»Trend-Following Strategies That Work!«
Second, he couples this with the idea of extent. This is the extent of the trend.
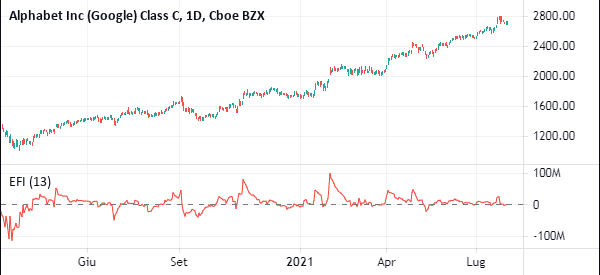
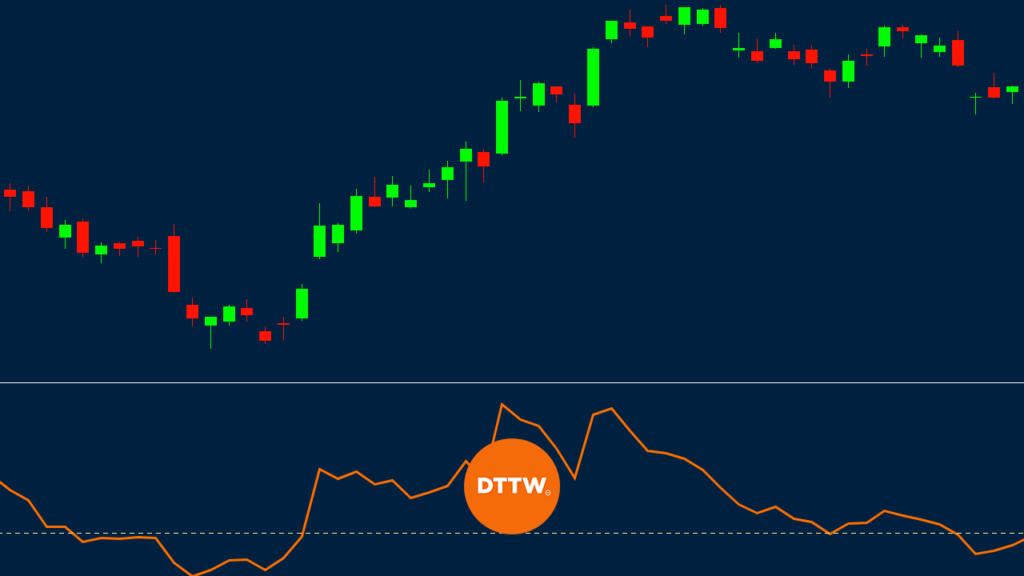
Finally, he talks about volume. The Force Index is a combination of the three aspects. The index can be used to reinforce a trend, predict corrections, and identify divergencies. When it is applied on a chart, the Force Index is usually a single centreline and a single line.
The chart below shows how the Elder Force Index looks like in a chart.

Force Index Calculation
The Force Index is one of the easiest indicators to calculate. There are just two main steps you need to follow to calculate the indicator.
First, you need to calculate the first Force Index. You do this by subtracting the previous close from the current close and then multiplying the result by the volume. You can get this data from the broker’s software.
The next step is to calculate the force index for your preferred period. In most software, the default period is usually 13. So, you calculate the 13-period EMA of force index.
The formula below shows how the Elder Force Index is calculated:
| Force Index = Volume (today) X ( Close (today) – Close (yesterday) |
The bigger the volume, the greater the force. In this index, when the indicator rallies to a new high, it means that the force of bulls is higher and that the uptrend will likely continue. Similarly, when the force falls to a new low, it means that the force of bears is intense and that the downward will likely persist.
Day Trading With the Force Index
The Force Index has three important elements. First, the change must always be negative or positive. It is positive when there are more buyers than sellers and negative when there are more sellers than buyers.
Second, the extent of the move is important. The extent shows how far the prices have moved. A big positive advance show that there is more buying pressure while a big negative advance shows more selling pressure.
Finally, volume is an important element because it shows commitment of the buyers and sellers.
How do you read it?
As you will find out, the Force Index will always be positive when the present price is above the previous price. Similarly, it is negative when the current price is below the previous price.
Another thing you will realize is that the extent of the move is what determines the multiplier. Finally, as we mentioned above, volume plays an important role in all this. A big move on high volume will always lead to a higher Force Index.
How to use the Force Index Indicator
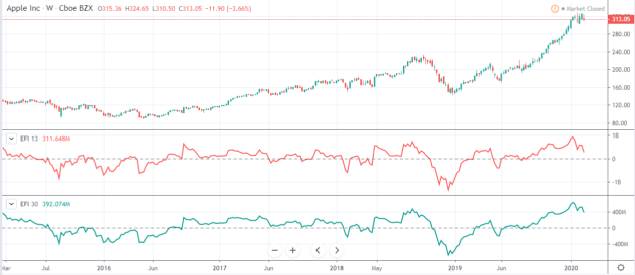
There are many ways you can use this indicator. One of the ways we use it is to confirm an ongoing trend. We do this by using a shorter and longer Force Index. Trader’s preferred number of days are 13 and 30.
When the trend is ongoing, we look at how the two indexes are. When it is above the centreline, it is usually an indication that the pair will continue moving upwards. You can observe this on the Apple chart below.

Another way you can use the Force Index is to combine it with other indicators like moving averages and the relative strength index.
Other Elder Force Index trading strategies
In his book, Elder proposed other ways of day trading using the Force index. First, he recommended buying wheh the 2-day EMA of the index moved negative during an uptrend. In this, he recommended buying above the high price of that day. On the other hand, you should short when the 2-day EMA turns positive during a downtrend.
Second, another buy signal emerges when there is a bullish divergence between the 2-day EMA of the force index and the price. Third, you should expect the price to rally when the index rises to five times or more its usual depth.
Advantages of using the Elder’s Force Index
There are several benefits you get by using the Force Index indicator. First, as demonstrated above, the indicator is very easy to calculate. This is unlike other indicators like Ichimoku Kinko Hyo and Money Flow Index.
Second, the indicator factors-in the three important aspects of trading like volume, direction, and extent. Third, the indicator is relatively easy to use.
Summary
The Force Index indicator is like a summary of Alexander Elder’s life work. The indicator has been in use for many years and is one of the easiest to use.
As a trader, we recommend that you first buy Alexander Elder’s books on forex and read them. They will take you into his mind and how he thinks about forex.
External Useful Resources
- How to identify trend and correction using Force Index? – Elearnmarkets
- Force Index in StockCharts


