

Have you ever met someone who sees signals all around them?
They look for omens and clues about what they should or shouldn’t do—these people find patterns in everything.
Rational people tend to dismiss “pattern finders” as superstitious and out of touch with reality.
The truth is somewhere in the middle: some people fabricate connections, while others ignore meaningful information. Two sides of the same coin.
In day trading, you need to be a bit on both sides. You need to be receptive to all information, and have a system for discerning which signals are meaningful—and which are just noise.
Technical indicators are one of the best ways to sort through all the information.
Volume indicators are one such form that is useful for determining the strength and direction of a trend. They can reveal hidden momentum in the market and help you pinpoint exact entry and exit points.
In this article, we will shed some light on the best volume indicators for day trading and how to use them.
Size Matters: What Makes Volume Indicators Useful
Volume indicators are essential analytical tools in day trading because they reveal helpful relationships between the trading volume of an asset and its price.
They provide insights into the strength or weakness of price movements, offering clues about the sustainability of trends.
Stock volume is measured in the number of shares, while options and futures volume is measured by the number of contracts that are changing hands.
Although simple trading volume is visible as a bar chart in most trading platforms, the best analysis comes from connecting volume levels to other characteristics.
By analyzing volume alongside price changes, traders can discern whether a recent price movement is supported by a significant amount of trading activity—potentially signaling a trend.
Trading expert and author Anna Coulling said that “once you begin to interpret and understand what the price and volume relationship is signaling, then you have arrived at trading Nirvana.”
While reaching Nirvana might sound like a stretch, when you learn how to read and apply the best volume indicators, you can make more informed decisions about buying, selling, and shorting assets in alignment with actual market momentum.
Why Volume Is Important in Day Trading
The price of an asset indicates how valuable the market thinks it is. The trading volume of that asset indicates the weight that price carries.
For example, if a stock moves from $10 to $15, that’s a significant jump in price (50%), but if the volume of stocks being traded is low, the price action doesn’t have much momentum.
Although assets don’t have literal “weight” or “momentum,” these terms are useful analogs because they describe how the asset behaves in the market.
If an asset’s price trends downward and there’s lots of volume, it’s a sign of significant selling pressure or momentum.
Similar to Newton’s first law of motion, an asset in motion tends to stay in motion, and the more “mass” in motion, the more likely it is to continue—up to a point. Volume helps measure the momentum of an asset in a given price direction, and it also helps identify when the momentum wanes.
So, what does this information mean to day traders?
Confirmation of Trends
Volume indicators can help you assess how strong a trend is and when it’s likely to reverse, which is where the real opportunity lies.
For example, an uptrend accompanied by increasing volume suggests strong buying interest and lends more credibility to the trend. Conversely, if prices are rising but volume is decreasing, it might indicate that the uptrend is running out of steam and could reverse soon.
This is critical for day traders, as they rely on timely entries and exits.
Identification of Reversals
Asset prices and trends can change abruptly; volume can help identify potential price reversals.
A sudden increase in volume can signal that market sentiment is shifting, possibly leading to a trend reversal.
For instance, if a security’s price declines rapidly, accompanied by high volume, it could indicate panic selling, after which the price might stabilize or reverse as selling pressure exhausts.
Validation of Breakouts
Volume is instrumental when confirming a breakout.
When a price moves outside of a trading range or pattern (like a channel or triangle), the validity of the breakout is stronger if accompanied by a surge in volume. High volume during a breakout suggests that many traders support the new price direction and are giving it momentum.
Liquidity Insights
Liquidity is vital for short-term traders. Volume is a reliable measure of a security’s liquidity, with higher volume indicating higher liquidity.
Day traders need enough liquidity to enter and exit trades when they want to and at the price they want.
Market Sentiment
We’ve talked about volume as an indication of momentum. That momentum is a proxy for market sentiment.
For instance, high volume during price increases might indicate bullish sentiment, whereas high volume during price decreases might indicate bearish sentiment. Once you begin to recognize the connection between volume and sentiment, the market’s behavior will begin to make more sense.
Take a Deep Dive: A Note on Training
Volume indicators are powerful tools—but only when you know how to read them in context. Without proper training, it’s easy to misread signals, chase false breakouts, or overlook momentum shifts that could make or break a trade.
That’s why structured practice is so important for the aspiring day trader.
It allows you to build confidence in your interpretations, recognize patterns over time, and refine your instincts without risking real capital. Here, simulated trading is crucial, as it allows you to test volume strategies in live market conditions and learn how different indicators behave during volatility, consolidation, and trend reversals.
Understanding volume is just the beginning. Learning how to apply it, adjust it, and trust it, that’s where skill meets experience. Education is a core tenant of Real Trading, and why we provide aspiring traders with an industry-leading training program.
With that note on the importance of training out of the way, let’s break down six of the most effective volume indicators for day traders—and how to use them in your own trading strategy.
6 of the Best Volume Indicators
Although there are more volume indicators than we’ve listed here, these six will provide most day traders with a foundation for everyday use.
Some of them are lagging indicators, because they use historical price data—don’t use them as predictive tools. Others are predictive, but still require confirmation from other indicators.
As with many of our recommendations around chart analysis and day trading strategies (and as mentioned above), it’s best to test everything in a simulator to learn and make mistakes without risking your capital.
1. Volume-Weighted Average Price (VWAP)
The volume-weighted average price (VWAP) gives a more realistic sense of an asset’s value because it provides a metric that combines volume and price.
It does this by averaging the closing price during the period in question while emphasizing periods with relatively higher volume.
VWAP resets every day, which is one reason day traders favor it.
Traders generally use the VWAP as a buying or shorting signal. For example, if an asset’s price is above the VWAP line, it signals that it is undervalued and worth buying. If the asset’s price is below the VWAP line, it may signal that it’s overvalued and worth shorting.
Because VWAP can give you a more holistic sense of an asset’s value (essentially, it’s equivalent to price + demand), it’s excellent as a guide for trading breakouts, reversals, and validating support and resistance levels.
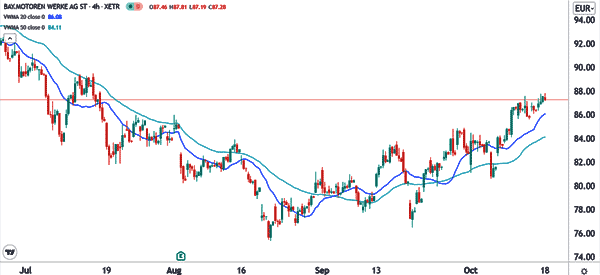
2. Volume-Weighted Moving Average (VWMA)
There are many types of averages and moving averages in trading. The simple moving average (SMA) is a common one, and uses an asset’s daily closing price.The VMWA takes the idea of a moving average and incorporates the volume of that asset over a given period, pushing the “value” up or down slightly when volume increases.
Analyzing an asset through VWMA’s lens can give a slightly more accurate picture of its value and in-demand status.
Traders can use the VWMA indicator like other moving averages to identify trends and find reversals, or identify bullish and bearish crossovers.
If the VWMA’s slope points downward and the price sits below that slope, it may mean the price will keep moving down. Conversely, if the slope of the VWMA points up and the price sits above it, the price may continue moving up.
The chart below shows the 20-day and 50-day VWMA applied to the BMW stock.
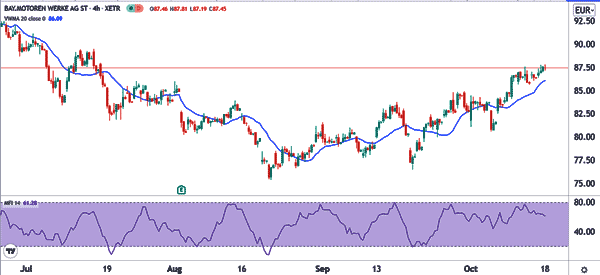
3. Money Flow Index (MFI)
The money flow index (MFI) is a similar indicator to the relative strength index (RSI)—the only difference is that MFI uses volume to return a value. When applied to a chart, a single line shows overbought and oversold levels.
The indicator was created by Gene Quong and is calculated using several steps:
- Calculate the typical price by adding the high, low, and close and then dividing by three.
- Calculate the raw money flow by multiplying the typical price with the volume.
- Find the money flow ratio by calculating positive and negative money flow over a given period. The MFI is then calculated like this: MFI = 100 – 100 / (1+ money flow ratio).
Since the MFI indicator resembles the RSI, you can use it similarly to find overbought and oversold levels.
When the MFI turns upward, but the price continues moving downward, the divergence can indicate an upcoming reversal. Conversely, if the MFI turns down, but the price keeps moving up, a downward reversal may be coming.
Some traders also use it to follow trends. The MFI rarely moves below ten and above 90, which can be strong signals for long and short trades. MFI can give false signals, so it’s best to use other indicators as confirmation.
The chart below shows the MFI for BMW’s stock over four months.
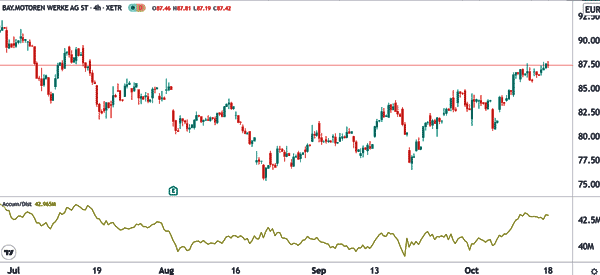
4. Accumulation and Distribution Indicator (A/D)
This indicator’s goal is to determine whether an asset is being accumulated (being bought) or being distributed (being sold). As a trader, you should always buy an asset that is being accumulated and short an asset being distributed.
A/D can help you assess how prices change due to supply and demand factors, including divergence between price and volume.
Because it combines high, low, and closing prices with volume, it can signal up and downtrends based on buying and selling pressure. A steep A/D line can confirm a strongly rising price that will continue, or a falling price that will likely keep falling.
In some sense, if volume gives traders a sense of how desirable an asset is, A/D provides an extra layer of fidelity into how volume affects price action.
The indicator is calculated by first taking the money flow multiplier and the money flow volume. The final stage is where you get the A/D line.
The chart below shows what the A/D indicator looks like using the same period of BMW’s stock as the previous chart.
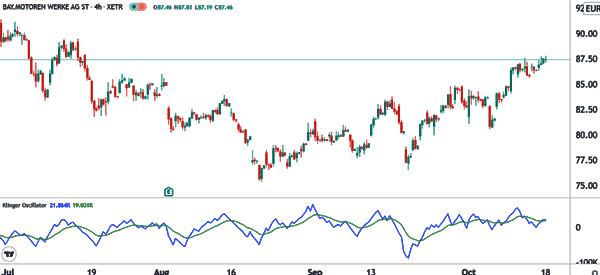
5. Klinger Oscillator
Developed by Stephen Klinger in 1977, this indicator helps traders predict long-term trends in money flow, retaining sensitivity to short-term fluctuations. The calculation is very complex, as it attempts to represent force volume, which aggregates multiple factors.
It shows the difference between two exponential moving averages and how volume affects long-term and short-term price direction.
You can use the Klinger Oscillator in several ways. First, you can use it to identify reversals. These reversals usually happen when the two lines of the indicator make a crossover. Second, you can use it to follow trends. However, it is prone to generating false trading signals when used apart from other indicators.
The chart below shows the Klinger Oscillator applied in a chart showing BMW’s stock.
6. On-Balance Volume (OBV)
First developed in 1963 by Joseph Granville, the OBV indicator is a momentum indicator mostly used in index trading. It is calculated by measuring the buying and selling pressure as a cumulative indicator, and then adding up days and subtracting down days in a session.
OBV is a predictive indicator that measures whether volume is flowing into or out of an asset. It uses changes in volume to suggest what will happen to an asset’s price based on crowd sentiment.
For example, large institutional investors may make large moves into an asset, followed by retail investors who notice the movement. OBV can signal these kinds of swings in volume and provide guidance for an asset that is about to jump or fall in price. Some investors see it as a sign of “what’s really going on” with an asset’s price.
The specific value of OBV isn’t useful. Most day traders look at OBV movement over time, with the slope of the line as the main focus.
OBV is best used in conjunction with lagging indicators. As a predictive indicator, it is prone to signaling trends that never materialize. The indicator can be used to identify market trends, find divergences, and identify buying and selling prices.
Volume Indicators Paint the Whole Picture
Volume indicators aren’t just add-ons—they’re essential tools for understanding what price alone can’t tell you. They reveal the strength behind a move, expose false signals, and help you spot when momentum is building or fading. For short-term traders who rely on speed, timing, and precision, that edge is everything.
Sure, price will always be the most obvious and important metric for any stock. However, if you focus exclusively on price action and avoid studying the best volume indicators, well, you will miss the second half of the story.
And what a valuable half it is.
At Real Trading, we equip traders with the skills to interpret these signals through structured training, market-tested strategies, and real-time simulations. Because knowing what to look for is one thing, knowing how to act on it is what separates the winners from the losers.
Ready to trade with clarity, not guesswork?
Build discipline, sharpen your analytical precision, and apply these tools confidently in live markets. Train with us at Real Trading.

