Success in trading depends on one major thing; how you identify opportunities and maximize on them. This is a secret all successful traders learnt when started trading full-time.
If you are able to identify when an opportunity arises, then chances are high that you will make a lot of money.
Unfortunately, identifying these opportunities is one of the toughest thing to do. Furthermore, if we all did that, then we would all be rich. Right?
No.
Only a few people have succeeded in identifying the opportunities and maximizing on them. The idea is that you want to identify a point in time when the price of an asset breaks-out.
For instance, if the price of crude oil is ranging between $40 and $42 a barrel, you want to identify a point where it breaks out and goes far up or down.
In this article, We will highlight some key ways to identify and trade breakouts.
Table of Contents
Types of breakouts
There are several types of breakouts in the financial market. Some of these breakouts are:
Continuation breakout
A continuation breakout is one that happens when a financial asset is rising or falling. It happens when an asset’s price pauses and then makes a continuation pattern.
In most cases, this breakout is usually confirmed using patterns like a bullish pennant, bullish flag, and bearish flag. A good example of this is shown below.

Reversal breakout
A reversal breakout happens when the opposite of a continuation happens. For example, assume that an asset is rising and then it consolidates.
Instead of having a continuation breakout, the asset then makes a bearish breakout. This is known as a reversal breakout.
False breakout
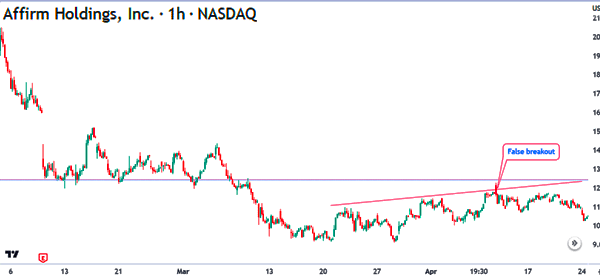
A false breakout is a situation where an asset in a consolidation makes a breakout and then quickly makes a reversal in the other direction. A good example of a false breakout is shown in the chart below.
The chart shows that the shares were in a consolidation phase when they moved slightly above the trendline. They then resumed the bearish breakout, signaling that the price action was a false breakout.

How to Identify Breakouts
#1 – Trendlines
This is one of the most commonly used methods of identifying and trading breakouts. The idea is to look at the chart, identify the highest and lowest points and then plot a line. The line will of course not touch all the points you identified but you should ensure that it touches a few of these points.
After this, you will look at the chart and make a decision on whether a breakout will be imminent or not. Keep in mind, the trendline can either move up or down.
If you spot an opportunity where the breakout is imminent, then you should make a buy or sell decision.
#2 – Channels
The second strategy you can use to spot and trade breakouts is using channels. The idea behind channels is similar to what trendlines do.
The only difference between the two is that in a channel, you draw the trendlines in the two sides. In this strategy, you want to connect the highest points and the lowest points in the opposite direction.
By doing this, you will come up with a channel and therefore you can easily spot the breakout point.
#3 – Triangles
The third strategy in trading breakouts is the use of triangles in analysis. Again, the idea involves drawing of lines as in the above method albeit with the aim of producing a triangle.
You simply want to draw two lines, touching the tops and the bottoms to form a triangle. When the triangle is formed, chances are that there will be a breakout there.
There are three types of triangles you can look at. They include:
- ascending
- descending
- symmetrical triangles
Ascending triangles are created when there is a resistance level and the market price continues to make higher lows. It is an indicator that the buyers (bulls) are making momentums over the bears.
The descending triangles are formed when there is a support level and the market price continues to make highs.
Finally, the symmetrical triangles are formed when the bulls and bears create higher lows and lower highs, forming an apex in the middle.
Related » Best indicators to trade breakouts
#4 – Bullish and bearish flags/pennants
Another way of trading breakouts is using the bullish and bearish flags and pennants, which we have covered in detail before. Pennants and flags happen after the price of an asset experiences a major spike.
The pennant is usually shaped like a triangle while a flag is shaped as a parallel channel. The two usually happens as some traders start exiting the trade while others come in. In most cases, a bullish pennant usually breaks out higher while a bearish flag breaks out lower.
Breakout entry and exit strategies
There are several entry and exit strategies when trading breakouts. First, you should always consider volume of the financial asset. If a breakout happens and is not supported by volume, then it means that it could be a false breakout.
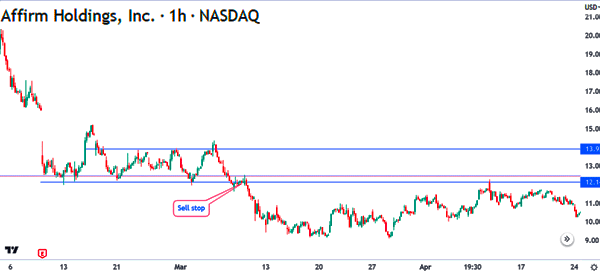
Second, you should embrace pending orders when trading breakouts. A pending order is one where you direct a broker to buy or sell an asset at a certain price. The most popular pending orders are buy stop and sell stop, and buy limit and sell limit.
For example, in the chart below, a trader would have placed a sell-stop below the lower side of the horizontal channel. In this case, the broker will implement a short order if a bearish breakout happens.

To stay safe, we recommend that you protect your trades with a stop-loss and a take-profit. These are important tools that will automatically stop your trades once specific levels are reached.
Finally, know about break and retest. This is a situation where a financial asset makes a breakout and then it retests the previus support and resistance. In most cases, this is usually a sign that the trend will continue.
Benefits of trading breakouts
There are several important benefits of trading breakouts in forex, commodities, and other financial assets. They include:
- Catch big moves – Trading breakouts is an excellent strategy if you want to catch big moves.
- Easy strategy to use – The breakout strategy is a relatively easy to use so long as you have a well-defined strategy.
- Can be used in all periods – The breakout strategy can be used across all periods, including minutes, hours, daily, and weekly.
What about false breakouts?
While the breakout strategy is excellent, its biggest risk is known as a false breakout (as stated above). It is usually a period where the price seems to be breaking out in one side and then suddenly reverses.
For example, in a bullish pennant pattern, it can appear as if the price is breaking-out higher and then it suddenly reverses.
To be fair, spotting false breakouts can be relatively tough. Still, there are several possible strategies you can use. The most ideal one is using pending orders, which are executed at a later period.
If you expect a bullish breakout, you can place a buy stop at an important level above the consolidation zone. Similarly, if you believe that the price will breakout lower, you can place a sell stop.
In the two examples, if you are correct, you will make money. However, if you are incorrect, nothing will happen. You can also use sell and buy limit orders to trade breakouts.
Final Thoughts
When using this strategy to identify the breakouts, it is important to consider a few details.
- One, you need to consider the timeframe that you will be using. In this, you should test various timeframes to ensure that you are in the right direction.
- The next thing you need to consider is that there will always be fakeouts. Fakout is a name used to mean a false breakout, and you must learn how to identify these!
- Third, you should test different indicators which you will use to test the performance of the strategy.
- Lastly, you should identify the best currency pair, commodity, or stock to implement this strategy.
Trading Breakouts – External useful resoruces
- Discover more about trading breakouts on Investopedia
- Read more strategies on how to trade breakouts on Thestreet


