

Trading breakouts can be one of the most profitable strategies in the market since it means entering a trade as early as possible.
However, in most cases, it can be a highly risky approach because of the so-called false breakouts. In this article, we will define what a breakout is and then identify some of the best breakout indicators to use.
Table of Contents
Define breakout
A breakout is a situation where a financial asset like a stock, currency pair, commodity, or cryptocurrency suddenly moves out of a support or resistance. When this happens in a high environment, it means that the new trend will continue for a while.
A good example of a breakout is shown in the chart below.
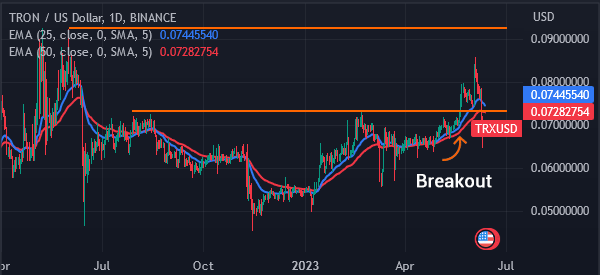
As seen, Tron found a strong resistance at $0.0725, where it struggled to move above in June 2022 and February 2023. It then made a strong breakout in May 2023, signaling that it could have more gains.
What are false breakouts
Another important aspect to think about when looking at breakouts is on false breakouts. A false breakout is a situation where an asset suddenly moves above a resistance or below a support and then the breakout fails.
In most periods, these false breakouts happen when there is little volume supporting the move. This is one of the riskiest things that can happen to you as a day trader since it can lead to substantial losses.
A good example of this is shown in the chart below.
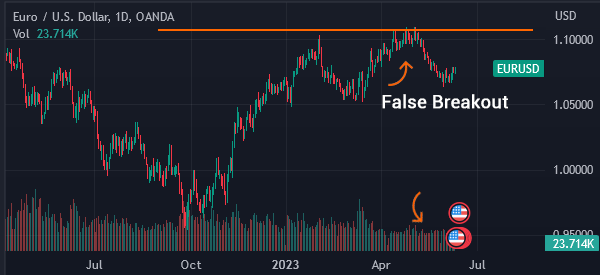
As shown, the EUR/USD pair made three moves above the resistance point at 1.1028. In this period, some breakout traders would have entered buy trades. However, the pair reversed and fell to 1.0705.
In all, trading breakouts can be a more profitable strategy than trend-following since it means entering a trade earlier. Trend-following is a trading strategy that involves buying an asset when it has already formed a trend. As such, it tends to have a lag compared to breakout.
Related » Sure Signs A Breakout Trade Will Fail
Breakout trading indicator
There are three main approaches to tackling breakouts in the market. First, you can use some chart patterns to predict the direction of a breakout. Some of the most popular chart patterns to trade breakouts are:
- Ascending and descending triangles
- Rectangles
- Head and shoulders
- Double top
Second, you can trade breakouts using candlestick patterns. These are unique patterns that signify a start or end of a new trend. Some of the most popular candlestick patterns you can use to trade breakouts are:
- Hammer
- Doji
- Shooting star
- Evening star
- Morning star
among others.
Finally, you can use technical indicators when trading breakouts. Technical indicators are tools created using mathematical calculations.
Some of the top indicators in the market are the Relative Strength Index (RSI), MACD, and moving averages among others.
Relative Strength Index (RSI)
The Relative Strength Index is a technical indicator that looks at the rate of change of an asset. Relative strength is calculated by dividing the average gain in a period and the average loss. It is then calculated using the following formula”
| RSI = 100 – (100/1+RS) |
The Relative Strength Index can be used to trade breakouts because it identifies extreme levels known as overbought and oversold levels. In many cases, it is also possible to use the indicator in trend-following.
A good example of this is shown in the chart below.
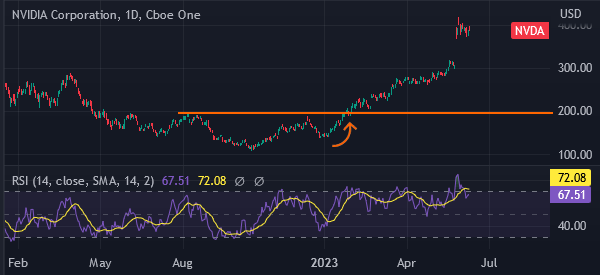
As we can see, Nvidia stock found a strong resistance level at $192.74. It struggled moving above this price several times since May 2022. It then made a strong bullish breakout in January 2023.
In this period, as you can see, the Relative Strength Index was above the neutral point at 50. As such, this can be a good sign to buy.
However, while the RSI is a popular indicator, it is usually not the best one to trade breakouts (or, rather, it is not as accurate as the other two). Instead, it is ideal for trading reversals and trends.
Moving averages
The moving average is the most popular indicator in the market. It refers to an indicator that looks at the average price of an asset in a certain period. For example, if a stock is trading at $200 and the last 7-day moving average is $170, it means that it is getting overvalued.
There are several types of moving averages, including volume-weighted, exponential, weighted, smoothed, and simple. The concept of calculating these indicators is the same but they include unique approaches.
For example, the simple MA looks at all days equally. As such, if you are calculating the 14-day moving average, today will have an equal role as 14 days before. Exponential moving average removes this noise by prioritizing present days.
One way of using moving averages to trade breakouts is to identify crosses. A good example is in this chart.
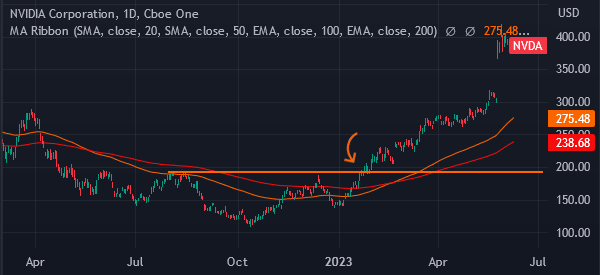
As you can see, the 200-day and 100-day moving averages made a bullish crossover. As such, this was a sign that the price was about to make a bullish breakout.
MACD
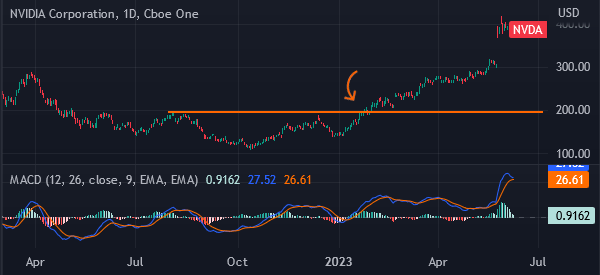
The Moving Average Convergence Divergence (MACD) is another indicator you can use to trade breakouts. It is calculated by transforming moving averages into oscillators. Since it is an oscillator, this indicator looks at extreme levels like overbought and oversold levels.
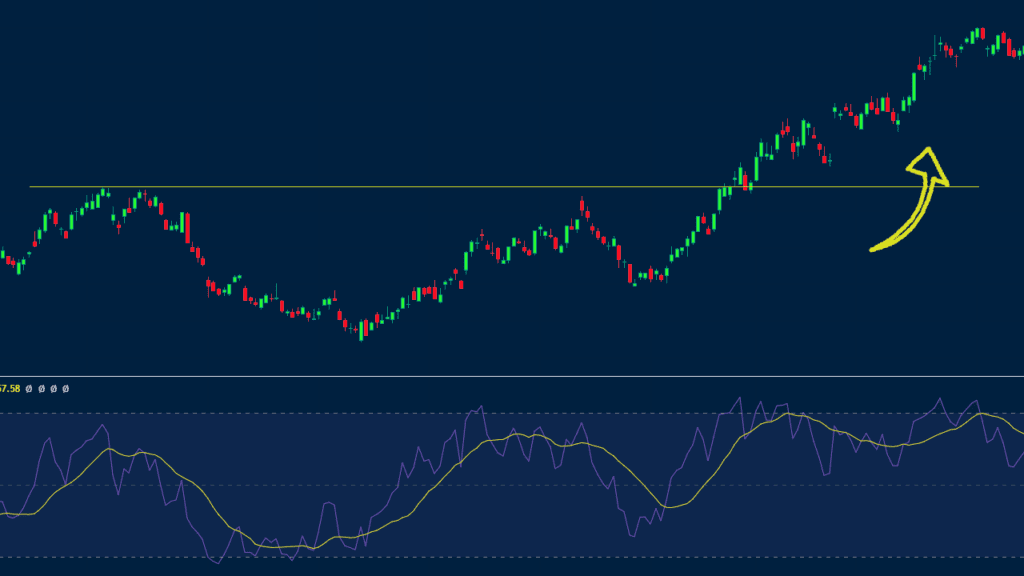
To some extent, it can also be used to trade breakouts. Traders confirm a breakout is happening when the two lines and the histogram of the indicator moves above or below the neutral point. This is shown in the chart below.
Volume
One of the most important breakout indicators to use is volume. In most periods, a breakout is confirmed when there is higher volume and vice versa.
When it happens in a high-volume environment, it is a sign that the asset will continue rising. The chart below shows that ETH made a small breakout when volume was rising.

Summary
Technical indicators, except volume, are not the best tools to use when trading breakouts. In most periods, we recommend that you use chart patterns like ascending triangle and double bottom to trade these patterns.
Here, our advice is to employ price action and use the indicators we suggested in this list as an additional step to support your ideas. And, above all, to prevent running into a false breakout.
External useful resources
- How to Measure the Strength of a Breakout – Babypips

