

Human beings are pattern recognition machines.
It’s an essential survival skill—our ability to notice what’s coming and respond quickly made all the difference between eating dinner and being eaten for dinner.
Thankfully, in today’s economy, we’re not worried about being eaten by wild animals.
However, as a day trader, your ability to recognize patterns in the market and respond quickly can make or break your profitability.
Veteran traders revere the break and retest strategy for helping them identify entry and exit points for trading an asset. It works on the idea that local price levels, once breached, can serve as critical indicators of where the price is headed.
In this article, we’ll explain how to recognize the break and retest pattern, as well as how to use it in your daily trading strategy for maximum benefit.
Article Outline:
- What Does “Break and Retest” Mean?
- How Day Traders Spot Break and Retest Opportunities
- The Charting Techniques You Should Use for Break and Retest
- The Pros and Cons of the Break and Retest Strategy
- Common Mistakes to Avoid with Break and Retest Patterns
- Catching a Break with a Proven Strategy
What Does Break and Retest Mean?
Break and retest is a technical indicator many traders love for its simplicity and observable price action. You can use it to capitalize on both short-term movements and longer-term trends.
A trade breakout is when an asset, such as a stock, commodity, or ETF holds a stable price range for a period of time and then moves quickly out of that range.
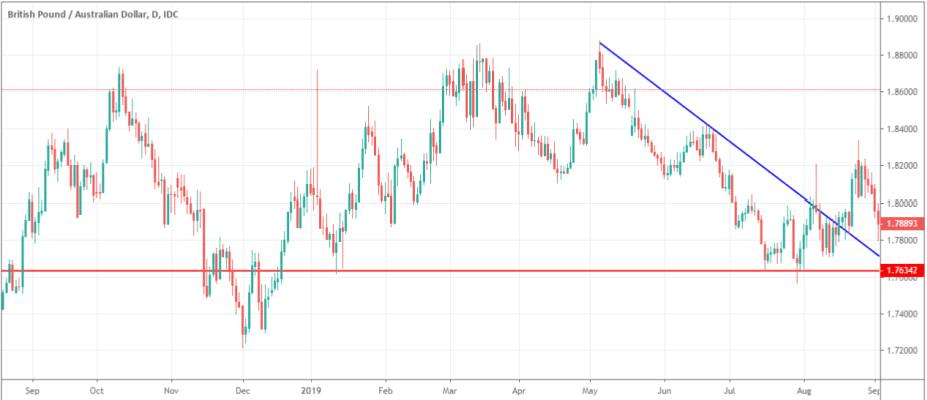
In other words, the asset breaks through its consolidation channel. It could break below a support level (indicating a bearish trend), or above a resistance level (indicating a bullish trend).
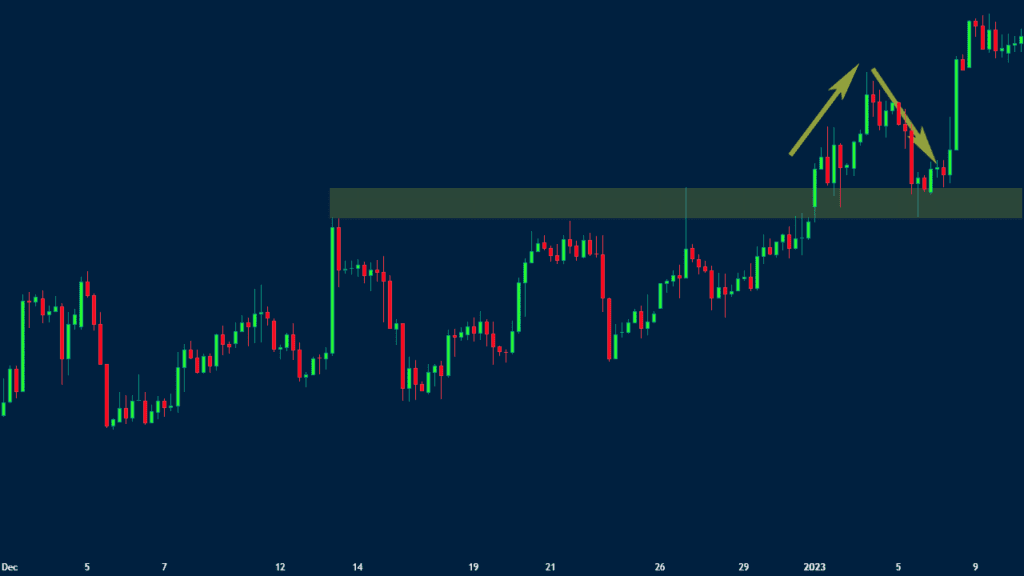
It’s easy to find examples of assets breaking through a support or resistance boundary. But the real opportunity comes when you spot the retest.
In a full break and retest action, an asset first breaks through a support or resistance level, and then goes back to that level, to retest it. This is done to confirm that the break determines a new support or resistance level.
The retest signals that the break will continue strongly, which helps you make a trading decision. Without a retest, you could easily get it wrong with a false breakout.
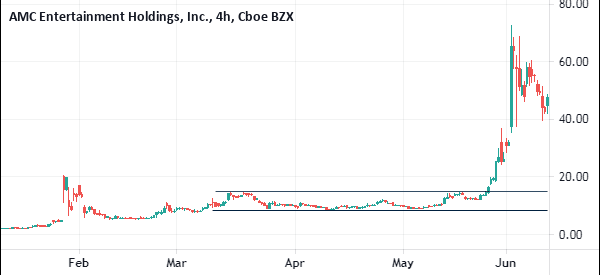
In the example below, AMC’s stock formed a resistance near $15. Then, the stock broke out above the resistance level, eventually hitting a high of $72, resulting in a gain of almost 400%.

Price actions like this are a daily occurrence. Not necessarily for every asset every day, but this pattern is visible across many asset types and markets. Once you begin to see it, you’ll see it everywhere.
How Day Traders Spot Break and Retest Opportunities
Let’s divide the break and retest strategy into steps so that it’s easier to identify each phase of the pattern, and how you should respond to each of them.
Remember, this pattern is based on human psychology and its effect on markets. Although the pattern is common, it’s not a natural force like gravity, which always behaves the same way.
This strategy works with 1-minute charts, 3-minute charts, and much longer periods, as the break and retest pattern can emerge at any time scale.
1. Identify Consolidation
As you analyze different assets:
- Pay attention to price support and resistance levels.
- Look for assets that are moving toward consolidation or are currently running in a channel.
A well-defined consolidation channel is a prerequisite for a break and retest strategy.
2. Wait for a Breakout
Watch closely once you notice the price pushing above the resistance or below the support. A break is a sign that bulls or bears have prevailed in the trading activity.
When a break happens, the previous support becomes the new resistance, and vice versa.
- It’s not yet time to execute a trade, because the pattern is new.
- Beware false breakouts. Don’t go all in on the first breakout you spot.
- Before acting, wait for the price to retest the previous resistance or support level.
3. Look for the Retest
To better understand a retest, let’s look at a bullish break example where buyers rush into an asset and initiate buy stop orders.
This pushes the price up, which triggers some bear traders to begin selling—which in turn pushes the price slightly down. When the price falls to the support level, the bullish traders pile in and push the price even higher.
The dynamics are the same for a bearish break and retest, just in the opposite direction.
- Spend some time studying historical charts for assets that you’re interested in trading.
- Do some training on the break and retest strategy, so you can recognize it faster.
- Use a trading simulator to test your strategy and dial in your risk management for that particular asset.
When you have high confidence that you understand how to spot retests, you’re ready to dive in.
4. Enter the Trade
Once you spot a break and retest pattern, it’s time to decide on your trade bias—long or short.
- If you think the asset’s price will increase, you should execute your buying plan.
- If you think it’s going to fall farther, set up a short trade.
5. Set Stop Loss and Take Profit Orders
This is the risk management part of the strategy. You can’t predict exactly how far the stock will move in any direction, but you can decide how much loss you’re willing to accept and what level of profit you think is most likely.
- Create a risk management plan ahead of time.
- Set the stop-loss order first to limit your losses if you get caught in a false breakout.
- Set your take-profit order based on a price that you think is highly likely and hopefully near the local maximum.
6. Monitor the Trade
After you’ve identified the pattern and set your orders, you should watch the asset closely.
Remember, there are no guarantees when it comes to human psychology. You’ve managed your risk, but there’s still plenty of opportunity to learn how the break and retest pattern plays out in practice.
Take notes on how your risk management strategy played out. Did you leave enough room in your stop loss order for the price to fully retest and resume the trend? Did you set your take profit order too low? There’s no “right” answer to these questions.
Charting Techniques for Break and Retest Strategies
Experienced traders may quickly spot break and retest patterns without using charting tools.
For everyone else, we recommend getting familiar with technical analysis and the following techniques to help you confirm the pattern.
Consolidation
You will see the price of an asset fluctuate within a fairly tight range. This range will be relative to the asset’s normal volatility, which is why it’s worth studying the asset’s trading history.
Use parallel horizontal lines to establish resistance and support levels—i.e., the consolidation zone. Think of this as the “calm before the break and retest.”
Consolidation is your first clue that the pattern may emerge, and you should begin planning your trade.
Channels
Consolidation is a common type of channel, but you may also see diagonal channels form, where the price steadily climbs or falls within a tight range.
You can still see break and retest behavior with a diagonal channel, but it’s much harder to spot because it’s not a consolidation pattern.
Wedges
The slopes of the support and resistance lines differ, as they are non-parallel and not exactly inverse.
A wedge occurs when an asset’s resistance and support lines begin to converge.
This tightening of the price action is usually a strong indicator that the trend is weakening and may cease or reverse.
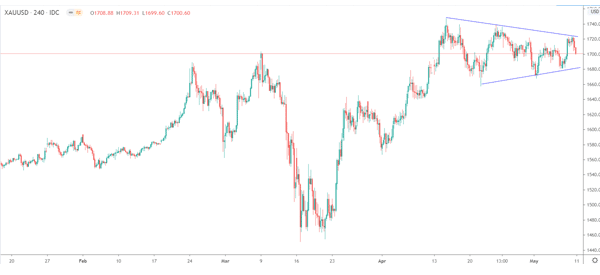
Triangles
Similar in shape to a wedge, triangles can help determine which direction an asset is likely to break. There are three types of triangles:
1. Ascending
An ascending triangle forms when an asset moves up until it finds a point of resistance.
Draw a line connecting the points of resistance and another line connecting the ascending lower price levels.
2. Descending
This type of triangle is the exact opposite of the ascending triangle. It forms when you see an asset steadily fall until it hits a support level.
Draw your line connecting the upper price points until it converges with the horizontal support line.
3. Symmetrical
Essentially, a wedge where the trend lines converge and have inverse slopes.
This type of triangle does not provide a good indication of which direction the price will break—it’s a sign of uncertainty. It could indicate that consolidation or a significant break is about to happen.
Treat symmetrical triangles as a “wait and see” sign and revisit the other charting methods to analyze how the pattern progresses.
Pros and Cons of the Break and Retest Strategy
A break and retest strategy is just one technique, and like all techniques, you must understand both its advantages to profit and its limitations.
While the break and retest cons might hurt your confidence, that’s okay. The only way to be a successful trader is to get a complete picture of the strengths and limitations of any given trading strategy.
Pro #1: Clear Entry and Exit Points
The strategy provides explicit criteria for entry and exit points. This level of clarity is the foundation of disciplined trading and risk management.
Pro # 2: High Probability Trades
Although it isn’t a guaranteed trend indicator, a retest greatly increases the probability that the original price break will continue. When you back it up with volume and momentum indicators, you have a good idea of what will happen.
Pro #3: Wide Applicability
This strategy can be applied in most markets, for most assets (stocks, forex, commodities), and across many timeframes. It’s one of the most versatile strategies a day trader can learn.
Pro #4: Price Action Reliance
The break and retest strategy depends on price action and current market sentiment, as opposed to complex lagging indicators.
Con #1: False Breakouts
We talked about this already, but it bears repeating.
It’s easy to convince yourself that a pattern is emerging and that you should enter the trade before anyone else. Waiting for a retest is a good safety measure, but even retests aren’t guaranteed protection against false breaks.
Con #2: Missed Opportunities
The exact opposite of a false break.
Sometimes, the retest doesn’t emerge, and you sit there watching other people make money while you wait for a confirmation that never appeared. It’s an occupational hazard for any day trader. All you can do is shake it off and prepare for the next opportunity.
Con #3: Subjectivity
As you may have gathered from the section on charting techniques, it’s easy to draw lines and fit the data to the pattern you want. This is also where the neutral mental posture comes in.
Trade in a simulator and practice identifying the various components of the pattern. Practice doesn’t make perfect; smart practice makes perfect.
Con #4: Market Volatility
Volatility can muddy the pattern. You can use charting techniques to separate signals from noise, but there are limits. If you misread the data during an erratic period, you’re far more likely to execute a losing trade.
Common Mistakes to Avoid with Break and Retest Patterns
In addition to keeping the disadvantages in mind, before you commit to a break and retest trading strategy, you must also be very aware of common errors that traders might make.
If a break and retest strategy isn’t working, it may be because you’re committing one of these mistakes.
Execution Errors
Wrong Timing
It’s worth waiting for the retest after you’ve flagged a break. It’s the best confirmation of where the price is headed. Inexperienced traders will try to jump the gun and trade too early—it’s the number one way to get caught by a false break.
Alternatively, if you wait too long and find yourself chasing the price in hopes of catching up, you’ll enter a zone with limited rewards and much higher risk. It’s better to wait for the next opportunity than to compensate with a late entry.
Ignoring Data
If you don’t consider the larger context of the market and trading volumes, your win rate will reflect this. Look for high-volume breaks and other trend-confirmation signals.
Also, beware of the tendency to misinterpret retests. We’ve mentioned several times that a retest is your best signal to enter the trade, but if you’re too eager and flag the retest prematurely, you’re more likely to lose money on the trade.
Psychological Mistakes
Poor Planning
If you don’t understand how to place stop loss and take profit orders, you will lose money when trades go bad, or you will wait too long.
The same goes for risk management: if you don’t know your risk-reward ratio heading into a trade, you will take unnecessary hits.
Design a plan and stick to it. If you discover the plan needs tweaking, that’s fine, but test your plan in the simulator before you trade on the live market. Disciplined traders make more money and are less susceptible to false breaks.
Overenthusiasm
Day trading is an exciting skill. Sometimes, new traders get caught up in the excitement and try to capitalize on every opportunity.
When you’re watching for break and retest patterns, you’ll see opportunities everywhere—be willing to let some of them go.
Wait for the big ones, where you have enough confirmation to proceed with your plan (you do have a plan, right?).
Proper Training Makes All the Difference With Break and Retest
As we’ve just covered, the break and retest strategy is something that every day trader should learn. But the power and simplicity can get you in trouble if you haven’t trained how to use it.
That’s why Real Trading has developed a comprehensive training program that helps new traders learn the fundamentals and practice new strategies in a risk-free environment. Our TMS™ simulator offers a realistic trading platform that anyone can learn on.
We also support new students with expert coaching and a structured learning plan so you only move to the live market when you’re ready. Explore our training program for more information.
The break and retest strategy is all about timing. Learning the right entry and exit techniques will massively increase your confidence when trading in the real world.
Catch a Break With a Proven Strategy
The break and retest trading strategy is great because it’s simple, reliable, and super versatile. Many traders use it to make money across various markets and assets.
What new traders often miss is the importance of risk management. Until you understand the nuances of risk management and can apply them to real-world trades, the benefits of a break and retest strategy will elude you.
At Real Trading, we believe that education and guided practice is the best way to achieve your trading goals. As a Real Trading student, you’ll study techniques from the best professional traders and master the skills of career day traders.
Great setups are hiding in plain sight – the sooner you start your training journey, the sooner you’ll see them and trade them successfully.

