

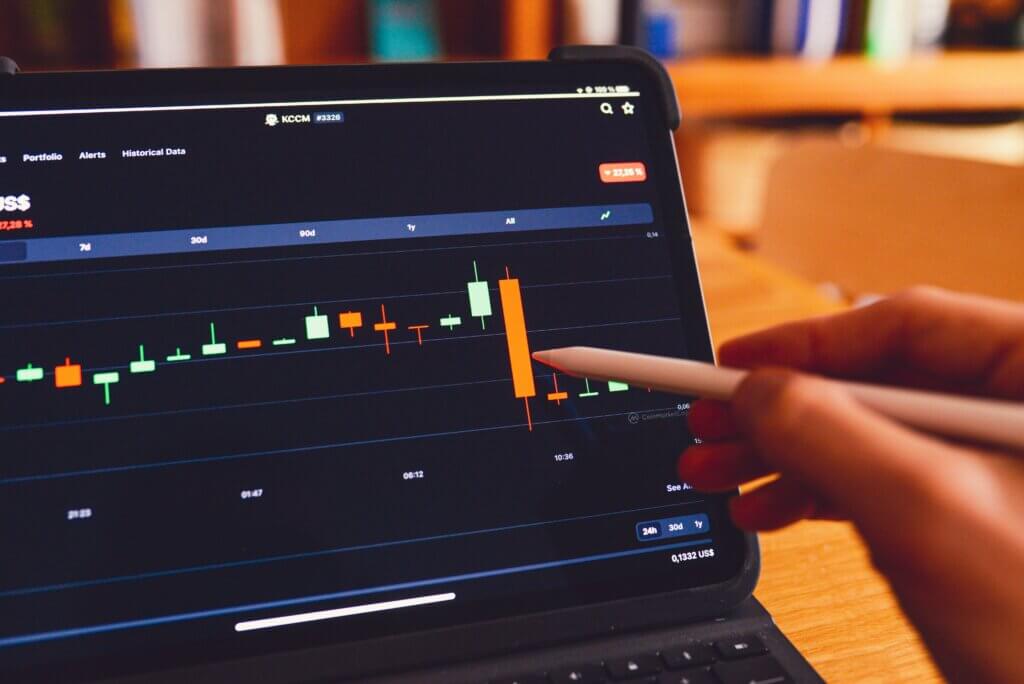
In day trading, charts are essential tools that help traders make informed decisions in fast-paced markets. They provide a visual representation of price movements, highlighting trends, momentum, and potential reversal points.
Among the various types of charts, candlestick patterns are the most widely used—and rightfully so, as they offer a detailed snapshot of market sentiment.
In this article, we’ll define a candlestick, its different parts, why it’s widely used, and patterns to watch for. We’ll also cover the common pitfalls of this tracking method so that your risk management is sound.
What Is a Candlestick Chart?
A candlestick chart is a type of price chart used in technical analysis that represents the price movements of an asset within a specific timeframe. It is widely used in day trading to identify patterns and trends in buyer and seller behavior, and to gauge the market sentiment in general
Candlestick charts originated in Japan in the 18th century, primarily used by rice traders. The method was refined by Munehisa Homma, a merchant, who recognized that market prices were heavily influenced by emotions.
Western financial markets later adopted candlestick charting, and it remains one of the most effective tools in technical analysis today.
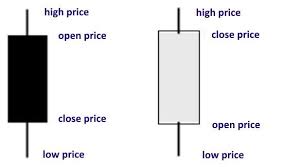
Parts of a Candlestick
Each candlestick has four key price points:
- Open price: The price at which the asset began trading for the selected period.
- Close price: The price at which it finished trading for that period.
- High price: The highest point the asset reached in that timeframe.
- Low price: The lowest point it dropped to in that timeframe.
These four price points are represented in the two main components of a candlestick:
- Body: The rectangular portion that represents the range between the open and close prices. A filled body indicates a bearish move (close price lower than open price), while a hollow body signifies a bullish move (close price higher than open price).
- Wicks (or shadows): Thin lines extending above and below the body, showing the high and low prices during the period. Longer wicks may indicate increased volatility, while short wicks suggest a more stable price action.
At rare times, you might identify a candlestick with just a body and without shadows. This is known as Marubozu, and means that the asset’s price opened at a high and closed at a low point and vice versa.
In a daily chart, a single candle usually represents a day. In an hourly chart, a single candle represents an hour.
Why Candlestick Patterns Are Essential for Day Traders
Candlestick patterns are unique arrangements that emerge when you look at a candlestick chart.
Many are well-known, as they repeat themselves and help to analyze assets. Before we uncover the different patterns, it’s important to understand why it’s beneficial to use candlesticks patterns when trading.
- Detailed price Information: Unlike line charts, which only show closing prices, candlestick patterns provide a full picture of market activity by displaying the open, close, high, and low prices for each trading period. This makes them more informative for day traders who rely on precise price movements.
- Widespread use: Candlestick patterns are universally recognized among traders, including the Real Trading community. This creates a common language for interpreting market trends. Whether analyzing bullish engulfing, doji, or hammer patterns, they are understood globally.
- Market sentiment visualization: The color and shape of candlesticks reveal the balance between buyers and sellers, helping traders gauge momentum and potential reversals. Long wicks indicate volatility, while strong-bodied candles suggest decisive market moves.
Now, let’s identify the different candlestick patterns.
Bullish Reversal Patterns
Bullish candlestick patterns are key indicators of potential upward price movement, often appearing after a downtrend to signal a reversal. These patterns help traders identify buying opportunities.
The most common bullish reversal patterns include:
- Hammer: A single-candle pattern with a small body at the upper end of the trading range and a long lower wick, indicating strong buying pressure after a decline.
- Bullish engulfing: A two-candle pattern where a bullish candle completely engulfs the body of the preceding bearish candle, suggesting a shift in momentum toward buyers.
- Piercing line: A reversal pattern consisting of a long bearish candle followed by a long bullish candle that opens below the previous candle’s low and closes more than halfway up its body, signaling renewed buying interest.
- Morning star: A three-candle pattern featuring a bearish candle, a small-bodied candle (which can be bullish or bearish), and a strong bullish candle, indicating a potential trend reversal as buyers regain control.
There are a few more patterns like inverted hammer, dragonfly doji, and three white soldiers that you can check in our cheat sheet below:
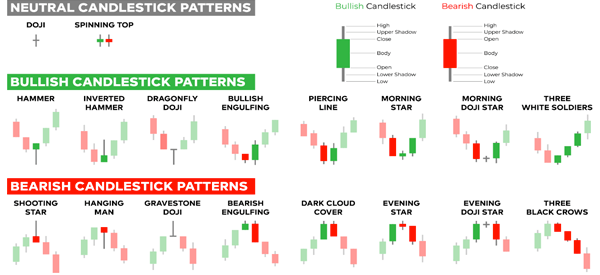
Bearish Reversal Patterns
Bearish candlestick patterns signal potential downward price movement, often appearing after an uptrend to indicate a reversal. These patterns help day traders identify selling opportunities.
Typical bearish reversal patterns include:
- Shooting star: A bearish reversal pattern with a small body at the lower end of the trading range and a long upper wick, indicating rejection of higher prices and a possible trend reversal.
- Hanging man: A single-candle pattern with a small body at the upper end of the trading range and a long lower wick, resembling a hammer but appearing after an uptrend. It suggests weakening bullish momentum and potential selling pressure.
- Bearish engulfing: A two-candle pattern where a large bearish candle completely engulfs the body of the preceding bullish candle, signaling a shift in momentum toward sellers.
- Dark cloud cover: A reversal pattern consisting of a long bullish candle followed by a bearish candle that opens above the previous candle’s high but closes below its midpoint, suggesting increasing selling pressure.
- Evening star: A three-candle pattern featuring a bullish candle, a small-bodied candle (which can be bullish or bearish), and a strong bearish candle, indicating a potential trend reversal as sellers take control.

Keep in mind that patterns aren’t always changing direction. There could be a continuation of the existing trend that would be advantageous to spot.
Continuation Candlestick Patterns
Continuation candlestick patterns indicate that the prevailing trend is likely to persist after a brief pause or consolidation.
Unlike reversal patterns, which signal potential trend changes, continuation patterns suggest that the market is gathering momentum to resume its existing direction. These patterns help traders confirm trend strength and identify potential entry points.
Flags and Pennants
Flags appear as small rectangular formations that slope against the trend. A bullish flag forms after an uptrend, while a bearish flag follows a downtrend.
Pennants are shaped like small symmetrical triangles and signal a temporary pause before the trend continues.
Three White Soldiers
This pattern consists of three consecutive bullish candles, each opening within the previous candle’s body and closing higher. It suggests strong buying momentum and a potential trend reversal from bearish to bullish.
Three Black Crows
The opposite of three white soldiers, this pattern features three consecutive bearish candles, each opening within the previous candle’s body and closing lower. It signals strong selling pressure and a potential shift from bullish to bearish.
Now that you have a good foundation, let’s analyze how successful day traders combine candlesticks with other technical tools.
Integrate Candlestick Analysis Into Your Trading
Candlestick patterns are a visual representation of price action over a timeframe, thereby providing valuable insights into market psychology.
But trading is not only about market psychology or sentiment: There are real numbers in play.
That’s why it’s essential to pair candlestick analysis with other trading tools. By working with multiple components in mind, traders can better read market sentiment and predict price movements with greater accuracy.
- Validate signals: Use patterns alongside technical indicators like moving averages, Relative Strength Index (RSI), and Bollinger Bands to validate sentiment signals and make more informed trading decisions.
- Identify support and resistance levels: Patterns such as doji, engulfing candlesticks, and hammer formations indicate potential reversals near key price levels, offering traders valuable clues about where price may stall or bounce.
- Combine with historical price data: This will determine whether a support or resistance zone is likely to hold or break based on insights into whether momentum is strengthening or weakening.
- Spot trend lines: Candlestick patterns can help to determine the strength of price movements by confirming whether price action is following a predictable trajectory or deviating from expected movements.
- Combine with volume analysis: This helps to reinforce the validity of price movements. Patterns formed during high-volume trading sessions carry more significance, as they indicate strong buyer or seller commitment.
By integrating candlestick analysis with technical indicators, trendline identification, and volume-based confirmation, day traders can build a winning strategy by better predicting market movements.
Don’t Be Overwhelmed. Learn with Real Trading.
We’ve introduced you to a lot of information till now.
Maybe you’re feeling a little overwhelmed at the prospect of taking all this, mastering it, and implementing it when the markets go live.
At Real Trading, we’ve partnered with some of the best traders from our global community to design a structured learning program and offer mentorship every step of the way.
Register and complete our basic and advanced courses—available 24/7 online, to fit your schedule. These courses include everything you see here about candlestick pattern analysis, risk analysis, and more, so that you can then practice on our TMS simulator.
The simulator has real market data, but with none of the risks. Understand how these patterns play out and put what you’ve learned to the test. Get coaching from our trading mentors.
Once you’ve proven yourself, you could get funded.
Start learning today with Real Trading.
Common Pitfalls in Candlestick Pattern Trading
As with any day trading tool, we’ve seen many traders make similar mistakes in their journey when using candlestick patterns.
Keep these in mind when trading, so you can easily avoid them:
- Ignoring context: Relying solely on a pattern without considering the overall market trend, support and resistance levels, or other relevant technical factors can lead to false signals.
- Lack of confirmation: Acting on a pattern before it’s fully formed or without waiting for confirmation from subsequent price action can be premature and increase risk.
- Low volume: Patterns forming on low volume may not be as reliable as those accompanied by significant trading activity.
- Over-reliance: Treating candlestick patterns as guarantees rather than probabilities can lead to poor risk management and unrealistic expectations.
- Subjectivity: Interpreting some patterns can be subjective, and different traders might see different things. It’s important to combine candlestick analysis with other objective tools.
- Ignoring timeframe: Analyzing patterns on an inappropriate time frame for your trading style can lead to confusion and ineffective signals.
- Risk management: Failing to implement proper risk management by setting stop-loss orders can negate any potential benefits gained from identifying candlestick patterns.
As you progress on your learning journey, dodging these pitfalls will become second nature.
A Reliable, Enduring Pattern
Japanese candlestick patterns are among the oldest types of charts.
Envisioned hundreds of years ago, they are the default charts on most trading software today. Use the right entry chart for your holding period and train yourself to spot the patterns for bullish or bearish trends.
But, of course, the prudent day trader will combine chart reading with context, confirmation, trading volume, and risk management strategies to stem losses.And the smart trader will learn how to do it with Real Trading.

