

In the realm of financial markets, patterns and indicators play a vital role in helping traders analyze price movements and make informed decisions.
Among the myriad of tools available, candlestick patterns stand out as a centuries-old technique that continues to captivate traders and investors alike. One such pattern, known as the “Three Black Crows,” holds a mystical allure due to its ominous name and distinctive appearance on price charts.
In this article, we delve into the depths of the Three Black Crows pattern, uncovering its origins, analyzing its formation, and exploring its implications for traders.
Whether you are a seasoned trader seeking to refine your skills or a curious beginner eager to unravel the secrets of candlestick analysis, this guide will equip you with the knowledge and tools to navigate the intricate world of the Three Black Crows.
Table of Contents
What is the Three Black Crows pattern?
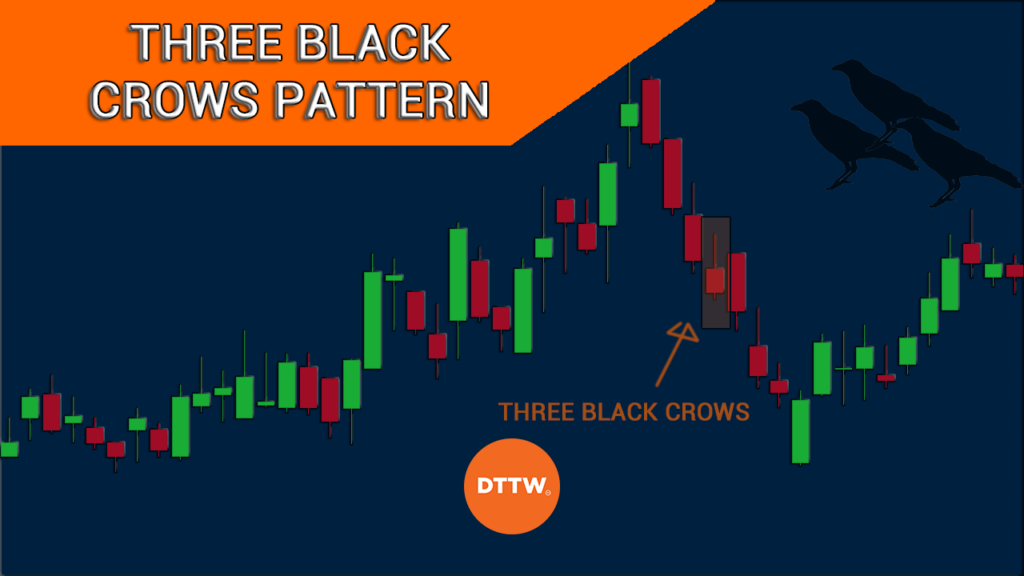
The Black Crows pattern is a reversal pattern that is characterized by three consecutive bars that happen during an uptrend. These bars can happen in a short chart like a 5-minute or a 15-minute chart. It can also happen in a long-term chart like a weekly or monthly.
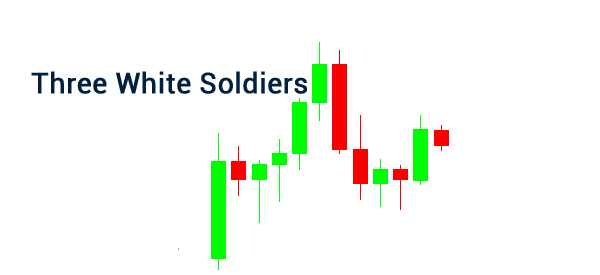
The three black crows candlestick pattern is the opposite of the three white soldiers candlestick pattern. The latter forms when an asset is in a downtrend and is a popular bullish reversal candlesticks.
This pattern – and the three white soldiers – is not all that common but is revered by technical analysts for its potential to provide valuable insights into market trends and reversals.
With its visually striking formation, this pattern can offer a glimpse into the psychology of market participants and their changing sentiments.
As an alternative, most traders focus on patterns like hammer, shooting and morning star, doji, and bullish and bearish engulfing.
Characteristics of the three black crows pattern
All candlestick patterns have several unique characteristics that help traders to make their decisions. This candlestick pattern has several important properties that you should know.
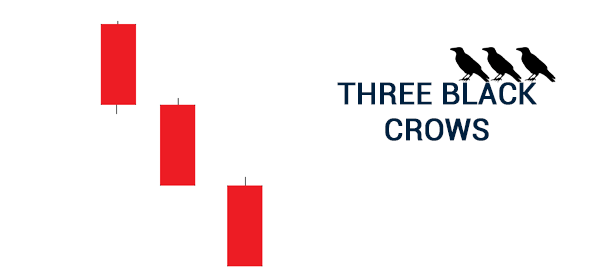
First, the most basic characteristic is that it is made up of three consecutive bearish candles. While the default in most trading platforms is red, you can always change the color of the bearish bars.
Second, it is common to see these bearish bars in charts. These candles should always close in the lower fourth of the range.
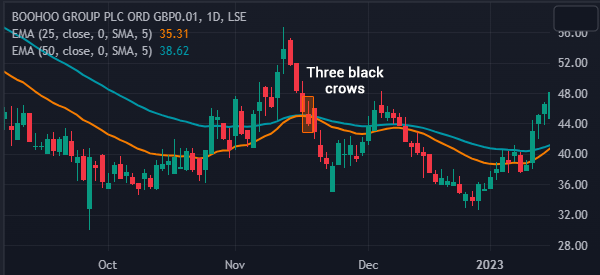
And finally, the wicks or the upper and lower shadows of the candles should not be very large. A good example of how this pattern forms is shown in the chart below.
Three Black Crows vs Three White Soldiers
When looking at candlestick patterns, they always have their inverse patterns. For example, the hammer candlestick pattern forms during a downtrend while an inverse hammer happens during an uptrend. A bullish engulfing pattern happens during a downtrend while a bearish engulfing happens during an uptrend.
In the same way, the three white soldiers pattern forms when an asset is in a downtrend. It is interpreted the same way, meaning that it is a sign of a bullish reversal.
What do the three black crows tell you?
The three black crows chart pattern is usually a sign of a bearish reversal in the market. It usually sends a message that an existing bullish trend is fading and that a new downward trend is forming.
The pattern also tells you that an existing trend is starting to fade. As such, in most cases, the three black crows candlestick pattern is commonly used when you want to short a financial asset.
The initial candle of the pattern tends to mean nothing. Traders then use the third candle for confirmation of the bearish reversal.
Related » How to Trade with 1 Single Candlestick?
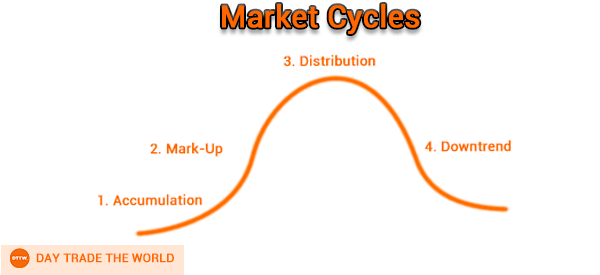
The three black crows are also used to signal that the asset has moved to a distribution phase, which happens when they start selling.
It is also worth noting that the start of the three black crows can be another candlestick pattern. In most cases, the initial candlestick is usually the inverted hammer candlestick, which is characterized by a small body and a long upper wick.
How to trade the three black crows candlestick
The three black crows candlestick pattern is not an easy-to-trade one. For one, the pattern can be confused with a short pullback, which happens when an asset is in an uptrend.
Therefore, there are several ways to confirm the bearish view of this candlestick pattern.
Look the first candle
First, look at the initial candlestick, which can also be a bearish one. Some of the popular bearish reversal patterns that happen before the three black crows are
- Doji
- Evening star
- Dhooting star
- Bearish engulfing
As such, if there is another strong bearish reversal candlestick, it is a good sign that the bearish view of the three black crows will work out.
Use indicators
The other approach is to use technical indicators like the moving average and Bollinger Bands. If you apply a moving average on a chart, the bearish view will be confirmed if the price moves below the moving average. A good example of this is shown in the chart below.
Via trading tools
Another approach is to incorporate trading tools in your charts. Some of the most popular trading tools you can use are the Fibonacci Retracement and the Andrews Pitchfork.
In this case, if the price moves below the 23.6% or the 38.2% retracement, it is a sign that the bearish trend will continue.
Finally, you can place a buy-stop trade above the first candle. The idea is that if the bearish thesis fails to work, your buy-stop trade will be initiated.
Limitations of the three black crows
There are three main challenges when it comes to the three black crows. First, unlike many other candlestick patterns, it is not all that popular. As such, focusing on it will often lead to limited trading opportunities.
Second, the pattern can happen when there is a short pullback. As such, placing a buy trade when the third candlestick forms can lead to higher losses if the price resumes the uptrend.
Summary
In conclusion, the Three Black Crows candlestick pattern represents a powerful tool for traders seeking to navigate the ever-changing landscape of financial markets.
By unraveling its mysteries and understanding its implications, traders can harness its predictive potential and gain a deeper understanding of market dynamics.
With careful analysis and the application of supplementary tools, the Three Black Crows pattern can become an invaluable ally in your trading arsenal, opening doors to new opportunities and increased profitability.
External useful resources
- Here’s Why Three Black Crows Are An Ominous Sign For The Stock Market – Kotak Securities

