Candlesticks are the most common chart patterns used in the financial market. Unlike line charts and bar charts, they give more information about the open, high, low, and close prices of an asset.
Professional traders use the candlestick patterns to predict whether the price will continue moving in a certain direction or whether a reversal will happen.
In the past, we have looked at several of these patterns, including evening and morning star, the hammer. and the gravestone Doji, which is one of the three popular Doji patterns.
In this article, we will look at the dragonfly doji, which is another popular type of the pattern.
Table of Contents
What is a dragonfly doji pattern?
A dragonfly doji candlestick pattern is formed when a candlestick has the same high, open, and closing prices. The candle can be on all timeframes, including on a daily, hourly, and 30-minute chart.
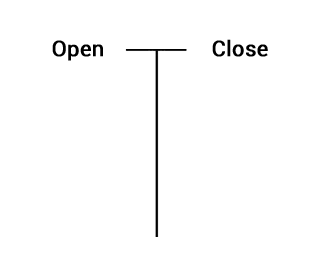
As shown below, the dragonfly doji has a similar appearance to the hammer pattern or capital letter T.
The dragonfly doji happens like this: an asset price opens and then sharply drops. Before closing, the price moves back up and closes at the point where it opened.

The dragonfly pattern signals that a financial asset started the session sharply lower and then buyers came back in before the session ended.
This candlestick pattern can happen across all periods. When it happens in the daily candlestick, it means that the stock opened lower and then closed at the opening price.
As shown above, the dragonfly pattern is characterized by a long lower shadow and no upper shadow. In some cases, the candle has a small upper shadow. Also, when the candle has a small body, it can be said to be a hammer candlestick.
Related » How to read candlestick’s shadow
The dragonfly doji can happen in an uptrend and in a downtrend. When it happens in an uptrend, it is usually a sign that the asset will reverse downwards and vice versa.
It is worth noting that, like other candlestick patterns, the dragonfly doji does not always imply that a reversal is about to happen. As such, traders and investors must always wait for confirmation before placing a trade.
When can this pattern can happen?
This doji pattern can happen inside a range or after a strong downward trend. If it happens when the asset price is ranging, it is usually a signal that the price will remain within the current range.
However, if it happens after a strong downward trend, it may be a signal that bears are tiring and that buyers are coming back.
In most cases, the length of the lower shadow is used as an indication of the strength of an upcoming reversal pattern.
History of the dragonfly doji pattern
The dragonfly doji candle is one of the types of the doji candle. The other types are the long-legged doji, standard doji, and gravestone doji. These candlesticks are known for having the same opening and closing prices, which explains its name.
The name doji comes from the Japanese language that means ‘the same thing’. It is not clear when the doji pattern was started. However, we can assume that the patterns were observed in the 1800s since the Japanese started using these candlesticks in the 1600s.
Examples of a dragonfly doji
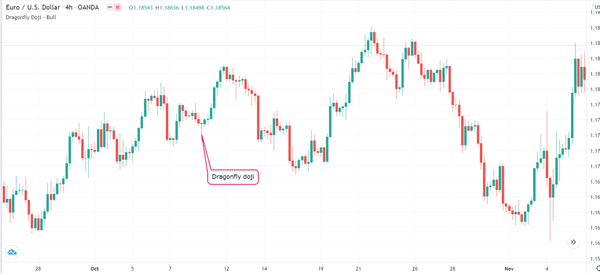
A good example of a dragonfly doji pattern is shown in the four-hour EUR/USD pair shown below. As you can see the price was in a minor downtrend when the price opened sharply lower and then ended the day close to where it opened.
That pattern was followed by a strong upward trend that pushed the price to 1.1830.

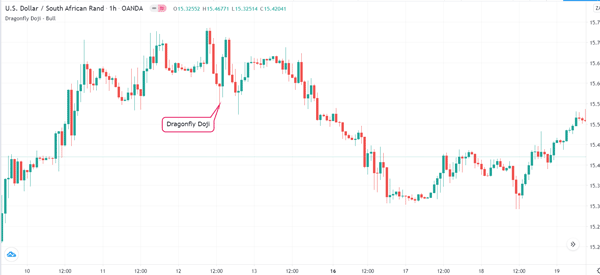
In the second example, we see the USD/ZAR pair also in a minor downward trend. The pair had fallen for three consecutive candles. The fourth one opened slightly below where the third one closed, fell sharply, and then closed near where it opened. The pair then made a minor bounce.

Psychology and interpretation of dragonfly doji
The gravestone doji candlestick can form in an uptrend or when an asset is in a downward trend. Like all other candlestick patterns, there are usually psychological explanations to it.
As mentioned above, the dragonfly doji candlestick happens when an asset opens, then dips, and closes at the same opening price.
Therefore, this can be interpreted that sellers were afraid of pushing it below the lower side of the doji. In this case, there are two ways to trade the pattern.
First, a trader can place a buy-stop above the doji candle or place a sell-stop below its lower side. The argument is that a breach below the doji candle will attract more sellers.
At the same time, placing a buy-stop above the dragonfly doji means that it will be triggered if the price makes a bullish breakout.
Best strategies of using the dragonfly doji
The dragonfly doji, like all the other candlestick patterns, should not be used in isolation. The best approach of using it is to combine it with other technical and price action strategies. For example, you can use indicators like the Average True Range (ATR) and double moving averages.
Most importantly, you should combine it with other volume-based indicators like the money flow index and the accumulation and distribution indicator. The benefit of using such volume indicators is that they will help you know whether the price action is supported by strong volume.
Confirmation and false signals
As explained above, using the dragonfly indicator blindly can lead to substantial losses. Therefore, it is always important to wait for a confirmation to happen before you place a trade.
There are several things to do to confirm a trend and prevent false signals. First, there is the manual approach of just waiting. In this case, you should just wait before you execute a trade. If you are a scalper, this means waiting for a few minutes.
Second, you should embrace the use of pending orders in trading. Pending orders refer to those that direct a broker to buy or sell an asset at a certain price. In this case, you can place a buy-stop above the doji and a sell-stop below the lower shadow.
Third, you can avoid false signals by using a multi-timeframe analysis. If it forms on the one-minute chart, look at the 5 and 10-minute charts to see the overall trend.
Finally, combine the dragonfly doji pattern with other patterns, tools, and technical indicators. Some of the tools to use are the Fibonacci Retracement, Andrews Pitchfork, and Gann Square. Indicators you can use are moving averages and the Ichimoku cloud.
Hammer vs dragonfly doji
As mentioned above, the hammer and the dragonfly doji pattern are extremely similar. Indeed, the two usually send the same signals.
The main difference between the two is that the doji opens and closes at the same place. A hammer, on the other hand, opens lower and closes slightly below the opening price.
In most cases, a dragonfly doji is usually viewed as a more accurate sign of a reversal.
Final thoughts
Dojis are popular reversal candlestick patterns in the financial market. They are formed when the price opens and closes at the same level in a sign of consolidation. The dragonfly is an important reversal pattern that you should consider using in your day trading.
External Useful Resources
- Dragonfly Doji: Top 5 things you must know immediately – Alphaexcapital


