

Trend following is the most important aspect in trading. This is because traders become successful by identifying a trend and following it to the end.
The biggest challenge when trading is on how to identify a trend and when a reversal is about to happen. While no method is accurate, traders use multiple approaches to know when a trend or a reversal is about to take place. One of those approaches is using trend indicators like the Directional Movement Index (DMI).
We will look at the main concepts of directional movement index and how to use it when trading.
Table of Contents
What is the Directional Movement Index?
The DMI is an indicator that was developed by Welles Wilder, who is known for developing multiple other technical indicators (like RSI). The DMI has been in use for more than 5 decades.
Wilder developed this indicator after years of observing the movements in the commodities market. Still, it is popular when used in other types of markets like currencies and stocks (here markets we offers to you).
How the DMI is Calculated
The process of calculating the DMI index is relatively long. However, as we have written before, as a day trader, you don’t need to know how this calculation works. Instead, you just need to know how to add the indicator on a chart and interpret it.
First, you need to calculate the True Range, plus, and minus the directional movement for each period you are looking at. Second, divide the 14-day smoothed +DM by the 14-day smoothed TR to find the Plus Directional Indicator. Then, multiply this figure by 100 to remove the decimal points.
In the next part, divide the 14-day smoothed minus DM by the 14-day smoothed TR and find the 14-day minus directional indicator. Like before, multiply it by 100 to remove the decimal point. Therefore, the DMI is equal to +D14 and -D14.
Finally, the Directional Movement Index is calculated by doing the 14-day DX.
How to Read DMI Indicator
The DMI is positive when the present price minus the previous high is bigger than the previous low minus the current low. As a result, this index is usually the same as the current high minus the previous high if it is positive.
The negative DMI is the opposite of that. It happens when the previous low minus the current low is bigger than the current high minus the previous high.
Having a good understanding of the theoretical foundation of the DMI is a good thing. However, it is not a requirement that you know it. What you need to know is how to apply it on the market.
The chart below shows the DMI indicator applied in a EUR/USD chart.
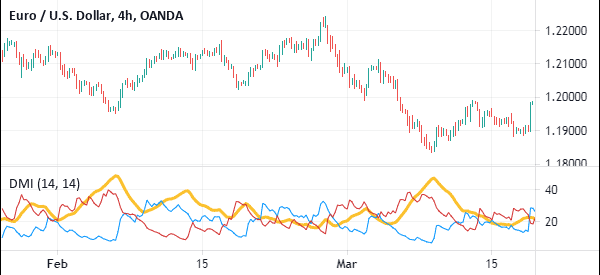
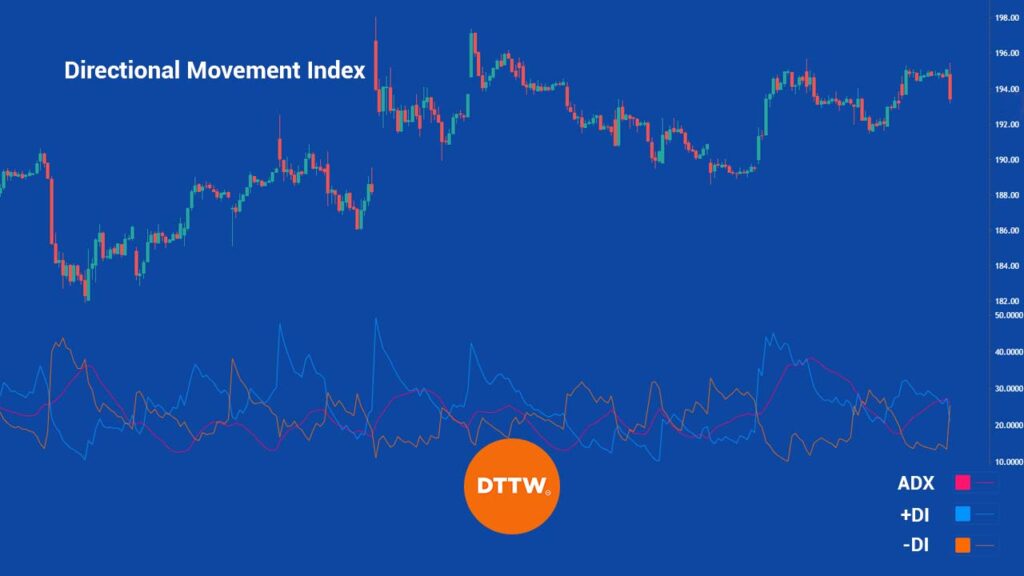
As you can see, the DMI indicator has three lines, which have different colours. You can always change these colours to suit your trading preferences. In the chart above, the yellow line is the ADX, and is the most important. It is the one that shows you what is happening.
An ADX figure of 25 and above shows that there is a strong trend while that below 25 and falling sends a signal that there is no major strong trend. The blue line is the positive DM while the red line is the negative DM.
What is the positive Directional Indicator (+DI)?
The +DI is part of the ADX indicator that is used to measure the presence of an uptrend. In this case, when the +DI is rising and is above the -DI line, it means that the uptrend is strengthening. On the other hand, when the +DI is falling and is below -DI, it means that the downtrend is gaining momentum.
The calculation of the +DI is quite long. First, you need to calculate the +DM by subtracting the previous high from the current high. Second, you calculate the True Range (TR) for each period using the following formula:
Greatest of (current high – current low current high – previous close, previous close – current low).
The third stage is where you smooth the 14-period averages of +DM and TR using the Exponential Moving Average (EMA). Finally, calculate the +DI using the following formula: (100 X EMA of +DM) / EMA of TR.
What is the negative directional indicator (-DI)
The negative DI is part of the ADX indicator that is the opposite of the +DI. This means that if the line is in a downtrend, it is a sign that the downward momentum is getting stronger.
A sign that the downtrend is strengthening emerges when the -DI is pointing upwards and is above the positive DI. A crossover of the +DI and -DI is a sign that a new trend is starting.
The -DI line is calculated using the same formula as the +DI. In this, you first calculate the minus DI and then calculate the TR and then you use this formula: -DI = (100xEMA of -DM) /EMA of TR.
How to use the DMI indicator
The DMI indicator is available in most trading platforms like the MetaTrader and the Our Propryetary Trading Software. When it is applied, the indicator reveals three lines: average directional index, +DI, and -DI.
The most common method of using the indicator is to know the strength of a trend. As such, it is only used when there is a trend and cannot be used in a ranging market.
The most common interpretation is to look at the ADX number. If the number is above 25, it is usually an indication that a trend is strong. When the ADX number is 20 and below, Wilder suggested that there is no strong trend.
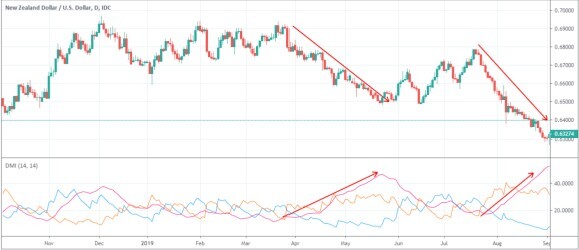
As a trader, you don’t need to limit yourself to these numbers. You can adjust these numbers to fit your style. We know many traders who use 30 as the base number to show a trend. A good example of this is shown on the chart below.
Before you use the indicator, ensure that the chart is either trending upwards or downwards. This is really important because it will not work well when the financial asset is ranging.
However, as with all indicators, the Directional Movement Index (DMI), is not always accurate. As such, it is recommended that you combine the DMI with other trend, oscillators, and volume indicators.
You should also use additional tools like Fibonacci Retracement and candlestick pattern analysis.
Pros and cons of using the ADX indicator
Pros of ADX:
- It is a relatively easy-to-use indicator since all you have to do is to look at its movement and the reading.
- It is widely used to complement other indicators like the moving average and Bollinger Bands.
- It can be used to analyze all financial assets like stocks, crypto, and forex.
- You can use it to distinguish trending and non-trending assets.
- It is one of the best tools to quantify the strength of a trend.
Cons of the ADX indicator:
- It cannot be used in non-trending assets.
- It is a lagging indicator that relies heavily on historical data.
- It tends to show some false signals when it is used alone.
Final thoughts
The DMI indicator is an important and relatively popular indicator. It comes prebuilt in the MT5 and MT4 and other popular trading platforms. It is also a relatively easy to use indicator. You should practice with it using a demo account for a while before you use it in the market.
External Useful Resources
- Directional Movement (DMI) on Tradingview
- How To Combine The Best Indicators And Avoid Wrong Signals – Tradeciety

