A trend is probably the most important thing in day trading and long-term investing. In most cases, traders are usually interested in identifying a trend early and exiting it when it reverses.
The most successful traders can identify a new bullish trend and buy and then enter a short trade when this trend ends. This article will look at some of the top strategies of identifying an end of a trend.
If, on the other hand, you have any doubts about the best strategies to adopt to identify a trend before it forms (or in its early stages), we recommend this read.
Table of Contents
Case study: Bitcoin
The daily chart below shows that the Bitcoin price was in a major upward trend starting from March 2020 until April 2021. At the time, anyone who bought the digital currency made money.
However, we see that this trend ended when the coin rose to an all-time high of about $65,000. A closer look at this chart can help us know how to identify the end of a trend in trading.
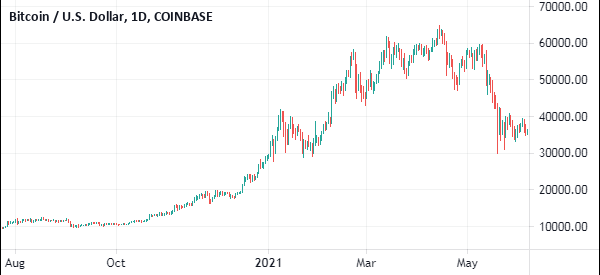
The ups and downs had by Bitcoin in recent months make it a perfect versatile case study to go and analyze the best strategies to predict the end of a trend and benefit from it.
»Trend-Following Strategies That Work«
Spot the end of a trend with technical analysis
Look for a double or triple top
One strategy to identify an end of a trend is to look for a double or triple top pattern. A double-top pattern happens when an asset’s price rises to a certain peak and then retreats. The price then rises again and finds resistance at the first peak level.
If it fails to move above the first resistance, it can be a signal that this trend is about to end. This is because it implies that there are not enough buyers above the initial resistance.
In some cases, the price will tend to retreat and then rise and retest the initial level of resistance. This is known as a triple top pattern.
Therefore, if you are long an asset and it forms a double or triple-top pattern, you could exit the trade since this is a signal that the trend is about to end. Alternatively, you could also short the asset, betting that the price will start a new bearish trend.
To do it well, you could place a sell-stop trade below the neckline of the double and triple-top.
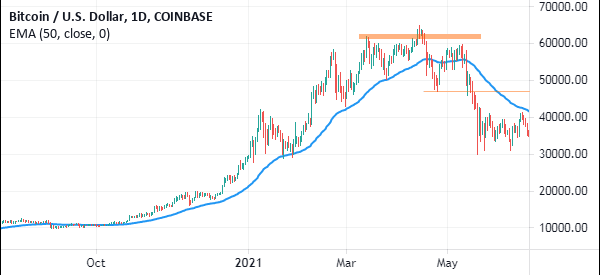
We can see this pattern clearly on the Bitcoin chart above. In it, we see that the currency formed a triple-top pattern above $60,000 and a neckline at $47,000. This was a sign that the bullish trend was ending.
Using moving average
Another simple strategy to identify the end of a bullish or bearish trend is to use a moving average. As you already know, the MA is one of the most effective trend-following indicators in the world. There are several types of moving averages like the simple, exponential, weighted, and smoothed.
The moving average can help guide you when you are long or short an asset. In an upward trend, the price will remain in a bullish trend so long as it is above your preferred MA.
Our favorite approach is to use the daily chart and the 50-day exponential moving average. In this case, the bullish trend tends to remain intact as long as the price is above this MA.
We can see this clearly on the Bitcoin chart. As you can see, as the price rose, it remained above the 50-day MA. It attempted to move below this MA in January 2021 but bulls returned. It finally moved below the MA completely in May as the new bearish trend was starting.
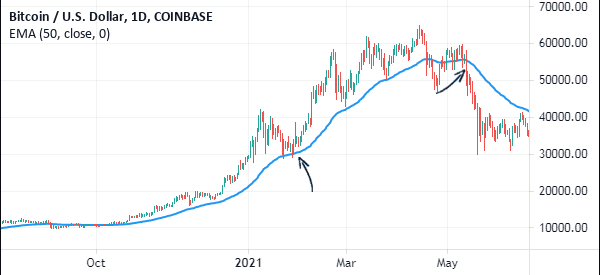
Another way of using the moving average to identify when a trend is about to end is to use two of them. In our case, We prefer combining the 50-day and the 25-day moving average. We use the 25-day MA as the fast signal and the 50-day as the validator of this reversal.
In this case, if the asset crosses the 25-day moving average, We assume that the end is nearing but We remain long. The end of the trend is validated when the price manages to move below the 50-day EMA or when the two averages make a bearish crossover.
Instead of the 50-day and 25-day moving averages, many long-term traders use the 50-day and 200-day moving average in a process known as a death cross.
Other technical indicators that can help you identify the end of a trend are Bollinger Bands, Donchian Channels, and Ichimoku.
»The Best Trend Indicators for Day Trading«
Spot the end of a trend with price actions
Reversal patterns
You can also identify the end of a trend using several reversal patterns that we have covered before. Some of the most popular of these patterns are the rounded top or bottom, rising and falling wedges, and the head and shoulders pattern.
The rounded top happens when an asset’s price rises to a certain level and then it starts to gradually decline. In the end, it forms what looks like an inverted saucer.
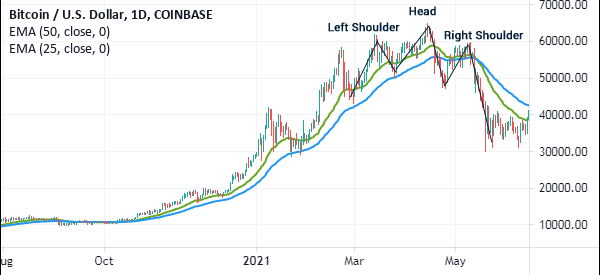
The head and shoulders pattern happens when an asset whose price is rising forms an initial peak and then drops. The price then rises above the initial peak and drops to the first support. It then rises and forms the right shoulders. When this happens, the price will typically break out lower.
A closer look at the Bitcoin price also shows that the coin formed a head and shoulders pattern and then broke out lower.
Candlestick patterns
For short-term traders, it is possible to use some of the candlestick patterns that we have covered before. Some of these patterns that can show the end of a trend are the doji, bullish engulfing, hanging man, three white soldiers, and hammer pattern.
These candlestick patterns, when used well, can provide signals of when the trend is about to end.
Summary
Identifying the end of a trend is not an easy thing to do. Still, using some of these strategies can help you identify when this is about to happen. Which strategy is best for you?
External Useful Resources
- How to Know When a Trend is Ending – BrokerXplorer


