

One of the most common questions that new day traders ask is, “How can I know which direction a stock is headed next?”
They may even believe that expert traders know the answer, and that’s what makes them so successful.
The answer? You can’t know. Nobody knows.
Here’s what you can do instead: study the behavior of a stock and analyze indicators of a change in direction.
A powerful—albeit underused—tool for this is the zig zag indicator. Different tools include the Relative Strength Index (RSI), the Bollinger Bands, and other momentum indicators.
In this article, we’ll explain what the zig zag indicator is and how it works, and how you can incorporate it in your day trading strategy. Armed with a deeper understanding of this indicator, you’ll be able to assess a stock’s position within a range of likely outcomes and make a better-informed decision about your next trade.
What Is the Zig Zag Indicator?
The zig zag indicator is a chart analysis tool that connects significant tops and bottoms (aka, highs and lows) to reduce the “noise” of minor price fluctuations.
Because the zig zag indicator is built to eliminate noise or insignificant movement in price, it’s considered a lagging (or “laggy”) indicator. As such, it only tracks price movement above a customizable threshold; usually 5-7%.
The tool is also useful for cross-analyzing your day trading behavior and looking for ways to improve. If you’re consistently trading out of step with an asset’s trend, the zig zag indicator can help you find those disconnections.
While it’s unfamiliar to many traders, it’s a useful tool that’s easy to install on most day trading platforms.
Take the MetaTrader platform as an example:
- Open the code base.
- Search “Zig Zag”.
- Download the module.
- Apply to the chart you’re looking at.
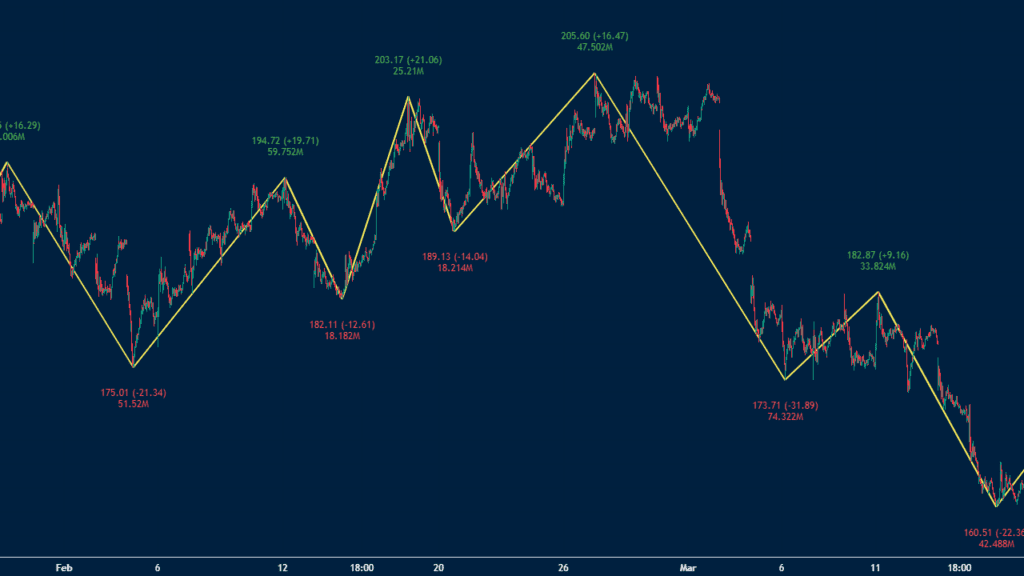
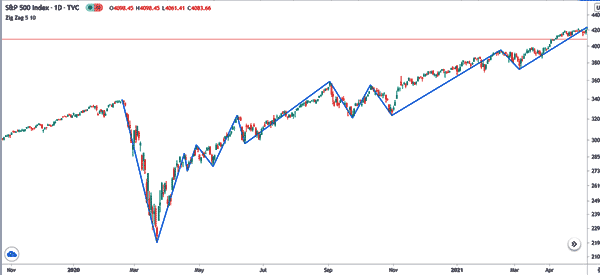
After you activate it, you should see a colored (varies by platform) line connecting the local tops and bottoms for the period you’re analyzing. As you can see in the chart below, the (in this case red) line gives you an approximate trend for the stock or asset.
If you’re watching a zig zag indicator in real-time, you’ll notice that it starts to draw a trend line based on where it thinks the price is going. However, if it fails to reach the minimum threshold, the trend line will change dramatically.
You can learn more about technical indicators like zig zag using the Real Trading training program.
The Three Zig Zag Settings
The zig zag indicator has three settings, all of which you can adapt:
- Depth
- Deviation
- Backstep
You can customize the settings to individual assets or your trading style—doing so will alter the trend line accordingly. Over time, you may find that a particular setup suits your trading strategy better than others.
No single approach or combination of settings is right or wrong. The goal is to identify the level of information that you need to help you make winning trades.
Before you customize the settings to your preferences, make sure that you fully understand what each of them mean and what they entail.
Depth
The depth setting specifies the minimum candlesticks that the indicator will examine before establishing a low, high, or pivot point in the chart. It’s often set to 12 by default.
This setting is critical for smoothing out the noise in a chart.
- If you set it too low, the indicator may prematurely identify peaks and troughs.
- Set it too high, and you may eliminate meaningful trends.
Depth functions as a filter to keep the indicator focused on significant movement, allowing it to mark reliable trends.
If you’re just starting out with the zig zag indicator, we suggest dialing this setting up and down to learn how the trend lines change for individual assets that you trade.
Deviation
The deviation setting is expressed as a percentage and establishes the minimum price threshold used to draw a trend line.
The default value is usually 5%, meaning that any price fluctuation under 5% will be ignored. If the price moves above 5%, then the indicator will integrate that value into the calculation.
Obviously, some stocks are more volatile than others.
Take that volatility into consideration when tweaking this setting:
- If you set the threshold too low, you’ll see a proliferation of shorter trends.
- If you set it too high, you’ll create an imprecise trend line that isn’t worth paying attention to.
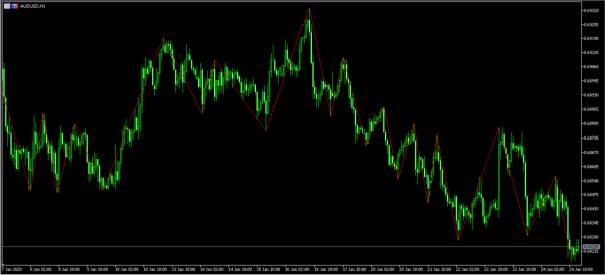
The chart below shows the same chart as above but with a deviation of 10%.
Backstep
The backstep setting defines the minimum number of price bars (or candlesticks) between significant tops and bottoms.
This setting is usually set to three by default and helps to eliminate noise in the chart by ignoring minor price reversals, as it determines whether there is a new high or low only after that number (three, in this case) of candlesticks has passed.
The higher you set the backstep to, the more price movements have to pass before you can confirm a new high or low, which can potentially reduce false signals. Dialing in the right amount of backstep ensures the trend line is accurate to the overall movement and ignores blips.
How the Zig Zag Indicator Calculates Trends
Until now, we’ve given you a somewhat theoretical overview of the zig zag indicator.
Next, let’s explore a step-by-step example of how it actually works, and how to use the zig zag indicator to calculate the trends of a given asset.
- Determine the starting point: after selecting the chart for an asset, look for a significant high or low price and select it as your starting point for the indicator. The depth parameter should serve as your base.
- Identify significant moves: move forward from the starting point until you find a price shift that exceeds your deviation percentage. The direction of the shift (up or down) determines whether you’re identifying a high or a low pivot point.
- Apply the depth parameter: once you identify a significant move, verify that it’s the highest high or lowest low within the number of candlesticks in the depth setting.
- Apply the backstep parameter: check that the newly identified pivot point is aligned with the backstep setting. Examine the backstep range and look for the most significant price point—ignore the others if necessary.
- Draw the zig zag line: connect the pivot points (highs and lows) with straight lines. These lines represent the significant trends according to the zig zag indicator’s parameters.
- Repeat the process: continue this process across the chart, moving forward bar by bar and applying the same criteria to identify new pivot points and draw new lines.
This manual explanation of how the zig zag indicator builds trend lines can help you understand what’s happening when you apply it automatically to a chart.
You can also use the zig zag indicator to locate waves and trends.
Next up: how do you learn more about how to apply this to your day trading activity?
Where Can You Learn More About the Zig Zag Indicator?
One of the most important skills for a day trader is the ability to turn theory into practice. The zig zag indicator may seem straightforward to you, but it’s easy to get overconfident with it.
That’s why we recommend that every trader undergo expert training, coaching, and simulated trading practice before using a new tool for live trading.
The Real Trading training program is structured to help you convert abstract theories and technical tools into practical skills. After studying the expert-designed curriculum, you can use our TMS™ trading simulator to test everything against real-world market conditions without risking any capital.
Minor changes to zig zag indicator settings can heavily influence your trading decisions – leading to big gains or catastrophic losses.
The better you understand how zig zag works, the better your results. Check out our training program and start upgrading your skills today.
How To Use the Zig Zag Indicator in Your Day Trading Strategy
The zig zag indicator is a versatile tool for analysis, as it offers valuable insights across several key aspects of asset behavior.
There are many ways in which you can incorporate zig zag in your trading strategy, and elevate your game. Let’s go over a few of them.
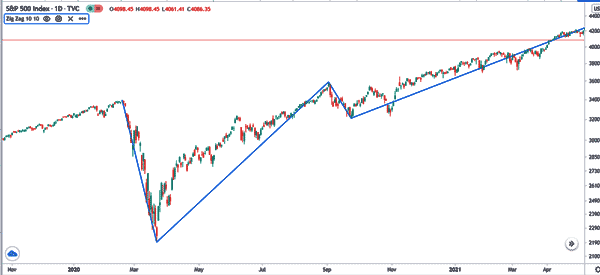
Identify Significant Price Swings
At its core, the zig zag indicator excels in pinpointing substantial tops and bottoms in an asset’s price.
By flagging these highs and lows, you can establish potential short or long positions, especially when an asset is moving in a channel. To do this, first apply the indicator and then use the equidistance tool. You can also draw trend lines, as shown on the chart below.
In this scenario, the goal is to buy when the price moves close to the lower line and sell when it moves to the upper line.
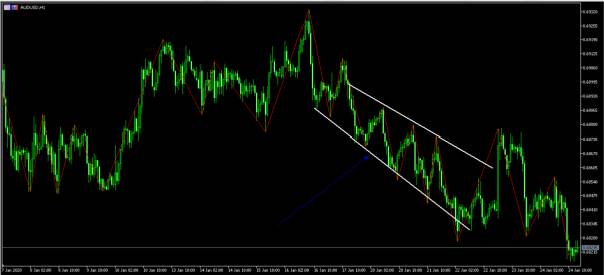
Enhance Elliott Wave Analysis
The Elliott Wave Theory, a fundamental concept in technical analysis, suggests that asset prices move in predictable patterns of five motive waves, followed by three corrective waves.
The zig zag indicator is indispensable for visualizing these wave patterns, making it easier for traders to anticipate market movements and align their strategies accordingly.
The chart below provides a good example.
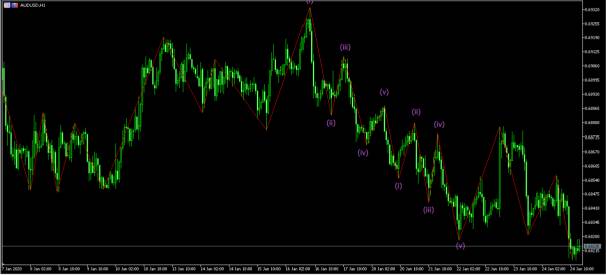
The first wave is usually a small rally, followed by a dip and then a major rally. The rally is followed by a small dip and another short rally. While looking at these moves is easy, the zig zag indicator makes it easier to spot the movements of the Elliott Wave.
Determine Optimal Entry and Exit Points
By filtering out minor price fluctuations and highlighting significant trends, the zig zag indicator helps traders choose the best times to initiate or close a trade for maximum profit.
Confirm Trend Directions
In combination with other forms of chart analysis, the zig zag tool is instrumental in validating the strength and direction of market trends. This dual-verification approach enhances decision-making confidence, allowing you to establish data-backed metrics for new trading positions.
Identify Chart Patterns
The indicator can be used to spot classical chart patterns such as head and shoulders, triangles, and double tops or bottoms. These patterns are important for predicting future market movements.
Determine Fibonacci Retracement Levels
In conjunction with the zig zag indicator, traders can use significant highs and lows to draw Fibonacci retracement levels. These levels can predict potential areas of support and resistance within the trend.
See Through the Volatility
The zig zag indicator helps traders focus on significant movements by filtering out minor price changes. This clarity can be particularly useful in volatile markets, where discerning the true direction of the market becomes challenging.
Combine with Other Indicators
The zig zag indicator can be used in combination with other technical analysis tools, such as moving averages or the Relative Strength Index (RSI), to confirm trends and signals. For instance, a trader might look for the zig zag lines to align with moving average crossovers or RSI divergences for stronger trade signals.
Limitations of the Zig Zag Indicator
There are many good reasons to learn how the zig zag indicator works and incorporate it into your strategy.
In a nutshell, by checking an asset through the zig zag’s lens, you’ll gain a better perspective on what’s happening and which price signals deserve your attention.
But, we do have to make a note here: as with all tools or methods of analysis, the zig zag indicator isn’t a silver bullet for your day trading armory. In order to use it to the best effect, you need to understand where it falls short as well.
- Lagging indicator: the zig zag indicator lags because it has to accumulate enough significant data to draw a new line. That means that it won’t help you predict the market or make real-time decisions.
- Subjectivity in settings: the three parameters (depth, deviation, and backstep) require manual adjustment, and their optimal values can be highly subjective, varying widely between assets and individual traders. This causes inconsistencies and a tendency to overfit historical data.
- Revisions trends: as new price data becomes available, the zig zag indicator may revise its lines, causing supposedly stable trends to disappear. Some traders find this trait confusing because they try to use the indicator for real-time trades.
- Reduces the market: by filtering out minor price movements, the zig zag indicator may oversimplify the market’s condition, causing traders to overlook shorter-term opportunities or emerging trends that don’t meet the set thresholds.
- Dependency on significant movements: the effectiveness of the zig zag indicator is based on the settings used to identify significant price movements. If an asset or market has low volatility, the zig zag indicator won’t reveal much to you.
- Potential for false signals: like all technical analysis tools, the zig zag indicator can generate false signals, especially in highly volatile markets where price direction can change rapidly and significantly.
While the zig zag indicator is excellent for filtering out noise, traders must understand how to fine-tune its parameters and combine it with other tools for maximum effectiveness.
The key to using any analytical tool or indicator effectively is to take time to learn where it’s strong and where it’s not.
Using the Right Tool at the Right Time
The zig zag indicator does not predict future price movements—remember, there’s no way to know this.
Instead, this indicator highlights significant trends based on historical data. You can harness its power to tune your trading analysis and understand the broader price behavior of a market or asset.
Mastering the zig zag indicator – or any technical analysis tool – demands a commitment to continuous learning and practice. At Real Trading, we help you learn the theories and skills of professional day traders, including:
- Step-by-step courses on technical indicators and trend spotting tools.
- Risk-free practice in a real-world trading environment.
- Coaching from experienced traders who will help sharpen your strategy and skills.
Although some traders might dismiss the utility of a zig zag indicator, you can see from this article that it’s a robust tool for sifting through conflicting price signals and market volatility.
Just like you wouldn’t use a golf cart to drive off-road or a bulldozer to cut your grass, the zig zag indicator works at the right time and place. The best day traders don’t guess or wait for luck to strike, they train and study constantly. You too can master the zig zag indicator and other day trading essentials by signing up with Real Trading today.

