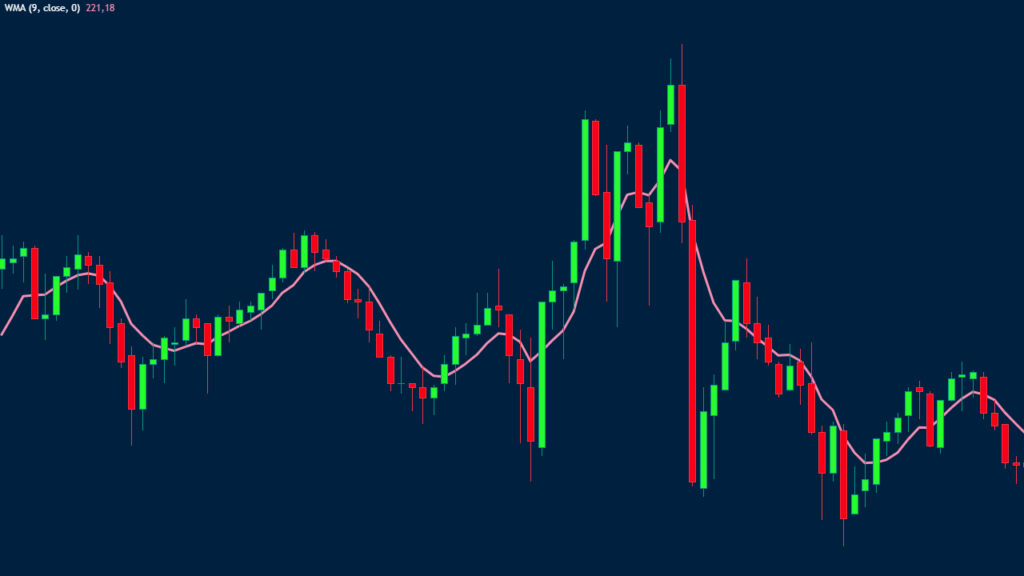
The Weighted Moving Average (WMA) is an important technical indicator that is used in the trading of all assets like exchange-traded funds (ETFs), commodities, forex, shares, and other assets. As you can easily understand, it is part of MAs family.
In this article, we will look at what the WMA is, how to calculate it, and some of the most popular strategies to use.
Table of Contents
What is the Weighted Moving Average?
Each of the three terms that form the WMA indicator has an important meaning. In statistics, an average refers to a figure that expresses the central or typical value in a certain period. For example, to calculate the average of three numbers, you just add them and divide them by three.
Moving, on the other hand, means that this type of average is not fixed. Weighted means that all numbers being considered are not taken equally.
All numbers are not equal
In Weighted Moving Average, the calculation gives recent numbers more weight and past numbers less weight. For example, if you are calculating a 50-day moving average, the WMA will give more emphasis to the recent days and less emphasis on the numbers at the start of the MA.
The WMA is part of a bigger community of moving averages. The Simple Moving Average (SMA) takes all of these numbers with equal weight. The exponential moving average (EMA), on the other hand, is relatively similar to the WMA but the calculation is relatively different.
Other types of moving averages in use today are Hull moving average, least-square moving average, and Arnaud Legoux moving average, among others.
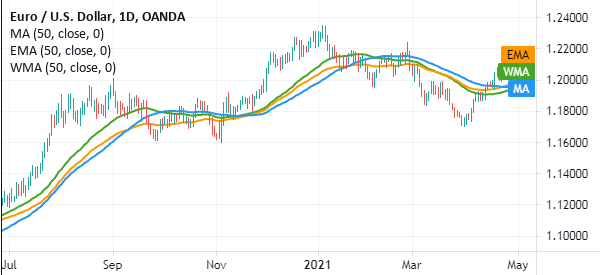
The chart below is a daily chart of the EUR/USD with a 50-day WMA, EMA, and SMA.
Calculating the WMA indicator
The WMA indicator is provided for free by all popular trading platforms like TradingView, Ninja Trader, and MetaTrader. Therefore, most traders are comfortable using it without the need for calculations.
To calculate the moving average weighted, you need to first select the period that you want to cover. An ideal period starts at 5-days. Next, take the numbers you want to analyze. These numbers can be closing, open, high, and low during a period. Taking these numbers accurately will help you avoid mistakes.
The next stage is to determine the weights of each number. As mentioned, in WMA, you should give much of the weight to the recent numbers.
Next, multiply each number by the weighting factor. After doing this, you should use the formula below to calculate the WMA indicator.

In this, n is the period under study.
How to use the Weighted Moving Average in day trading
There are two main methods of using the WMA and other moving averages in day trading. Here, we will look at some of them and how you can use them well.
WMA in finding reversals
The first popular method of using the WMA in day trading is to find reversals. For starters, this refers to a situation where a financial asset has suddenly changed direction. For example, if the EUR/USD is in a strong bullish rally, a reversal is when the pair starts to reverse in a bearish manner.
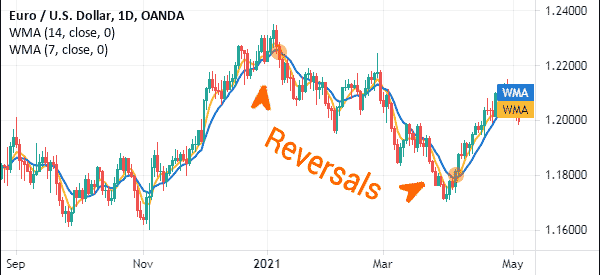
Like the other types of moving averages, you can use WMA to find these reversals. The most popular method of doing this is to combine two or more WMAs of different periods in a chart. Different traders use different periods when using this approach depending on their trading style.
The reversal, at this stage, will happen when the two moving averages make a crossover. If it happens at the lower side of a bearish trend, there is a high possibility that the price will have a bullish reversal, and vice versa. The chart below shows this WMA reversal on the EUR/USD pair.
The challenge that many people have in this strategy is finding the most recommended periods. Unfortunately, there is no periods that are recommended when using this strategy. It is up to you as a day trader to find the most useful periods.
For long-term traders though, there is something known as a golden cross and a death cross. These crosses are mostly used in daily charts to find reversals. The periods used are 50-day and 200-day moving averages.
Weighted Moving Average in trend following
Another approach of using WMA is in trend following. This is a strategy where your goal is to hold a bullish or bearish trade until a reversal happens.
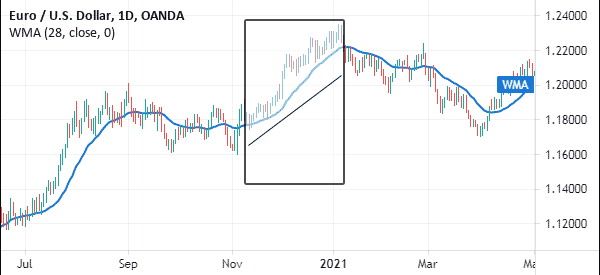
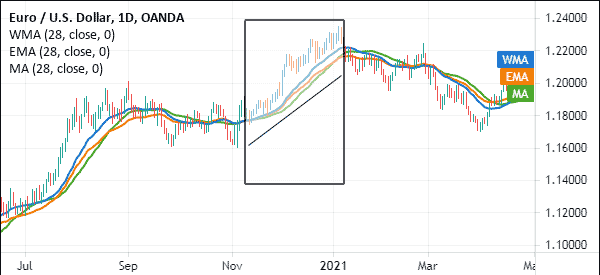
It is a relatively simple strategy to use. First, you must ensure that the asset is moving in a certain trend. Next, you should select the most appropriate period to use. Finally, if it is in a bullish trend, keep holding the trade so long as the price is above the moving average. Similarly, if it is a bearish trend, keep holding the trade as long as the price is below the MAs.
The chart below shows that the EUR/USD remained in a bullish trend when the price was above the 28-day WMA.
The other popular ways of using the WMA is by combining it with other technical indicators like the Ichimoku Kinko Hyo and the Relative Strength Index.
WMA vs EMA and SMA
A common source of confusion among day traders is on the best moving average to use in the financial market between WMA, EMA, and SMA. In our experience, you can use either of these indicators. However, We have found that the exponential and weighted moving averages are usually better than the others because it reacts to changes fast. Still, you can use either of them based on your trading strategy.
As shown below, the EMA and WMAs were quick to identify the reversals than the SMA.
Summary
The moving average weighted is a popular indicator you can use to day trade the financial market. In this article, we have looked at how it is calculated and how you can use it well to find buying and selling signals.
Do you already use it, or do you prefer other types of moving averages?
External Useful Resources
- Forex Trading Strategy: Combining Exponential and Weighted Moving Averages – Tradingpedia


