

Moving Averages are the most popular and useful tools in technical analysis. They are widely used by both day traders and investors in determining when to buy or short a financial asset like stocks, forex, and commodities.
Moving averages (MAs) are so useful that they are used to develop other indicators like Volume Weighted Average Price (VWAP), Bollinger Bands, and Donchian Channels.
There are numerous types of MAs, with the most popular ones being simple, exponential, smoothed, volume-weighted, and weighted moving averages. This article will look at the Arnaud Legoux Moving Average (ALMA), which is another common type of MA.
Table of Contents
What is the Arnaud Legoux Moving Average?
The Arnaud Legoux Moving Average is a type of moving average that was created by Arnaud Legoux and Dimitris Kouzis – Loukas in 2009. Their goal was to improve the performance of moving averages by reducing the lag that exists in other types.
The ALMA indicator solves the issue of lag using a mathematical concept known as Gaussian Filters. Gaussian is a mathematical concept named after Carl Friedrich Gauss and is the function of the base form.
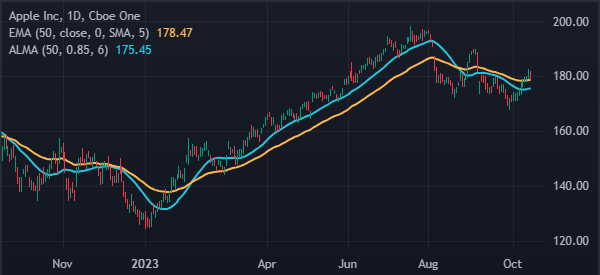
The chart below shows that the 50-day ALMA indicator reacts faster to assets than the EMA indicator.
Calculation of the Arnaud Legoux Moving Average
The ALMA indicator is calculated using a relatively simple formula. For most people though, knowing the calculation process and the formula is not all that useful since the tool is available in most platforms like TradingView.
As mentioned, the indicator is based on the weighted sum of an asset’s price over a period and the Gaussian time. The summary of this calculation is shown below.
ALMA = (Weighted Sum of Prices) / (Sum of Weight)
In this case, the weighted sum of prices is calculated by multiplying an asset’s price by the certain weight, which is determined by the trader.
This weight is created using a Gaussian format that places more weight to recent prices compared to older prices. In a 200-day ALMA, the recent prices are more important than those that happened 200 days ago.
The sum of weight, on the other hand, is the sum of all the weights used to calculate the ALMA. This weighting is done to ensure that the final moving average price has not been skewed by the whole process.
Key parameters of the ALMA indicator
The ALMA indicator has three key parameters that advanced traders need to know about: window size, offset, and sigma.
The window size is a feature in Arnaud Legoux Moving Average’s calculation that determines the period over which the ALMA is calculated. In most cases, the standard window size is usually 9 but you can always change this depending on your trading goals and approach.
The offset is a number that is used to adjust the average to reduce the lag. In most cases, the offset figure is set at 0.85%, meaning that 85% of the data is to the left of the maximum point of the Gaussian curve.
Finally, sigma, which is also known as the standard deviation of the process. This is an important number since sigma is what determines the width of the Gaussian curve.
How to read or interpret the ALMA indicator
The ALMA indicator is interpreted just as the other types of moving averages. During the Covid-19 pandemic, the US and other countries used to report the daily reading and the moving average. If the daily figure stood at 200 and the 7-day moving average was 100, it meant that the situation was getting worse.
The same applies to the financial market. If the asset’s price is at $20 and the 20-day ALMA is at $10, it is a sign that the price is ‘overvalued’. This is usually a sign that something triggered the move.
The bullish signal is usually identified when the price moves above the indicator and vice versa. We will explain below, the signals can also be identified when two moving averages make a crossover.
Arnaud Legoux Moving Average trading strategies
Trend
The most common ALMA trading strategy is known as trend following. Trend following is a strategy that involves buying or shorting into an existing trend. In this case, a trader will place a buy trade when an asset is already rising or a short one that is moving downwards.
Most analysts believe that trend following is the best and simplest way to trade. In this case, a trader just needs to identify an asset that is moving in a certain trend. You should then place the ALMA indicator and exit the trade when it moves below the average.
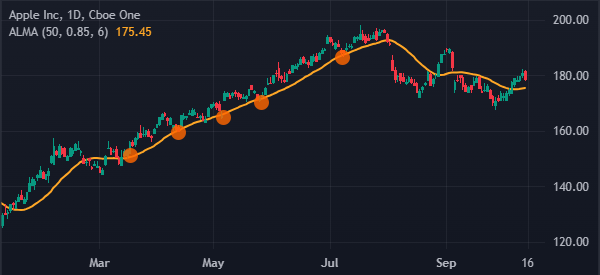
A good example of this is shown below. In it, the trader would have bought the Apple shares and held it until it crossed the moving average. The same approach applies to when an asset is falling.
Reversals
The other ALMA trading strategy is known as reversals. A reversal is a situation where an asset moving in a certain direction changes it. There are numerous ways of doing this but the most popular one is known as the death cross and a golden cross.
A death cross happens when the 200-day and 50-day ALMA indicator crosses each other when pointing downwards. A golden cross, on the other hand, is where the two moving averages cross each other when pointing upwards.
In most cases, day traders use smaller values like 50 and 25. The chart below shows that Apple shares reversed when the 50-day and 25-day moving averages made a bullish crossover.
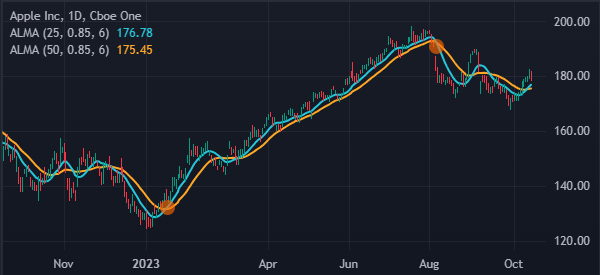
After this happens, the trader then holds the trade as long as it is above the two moving averages.
Crossovers
The other simple approach of trading the Arnaud Legoux Moving Average is to trade crossovers. This is an approach where a trader looks at a certain period moving average.
A buy trade is initiated when the price moves above the moving average while a short trade is initiated when it moves below the MA.
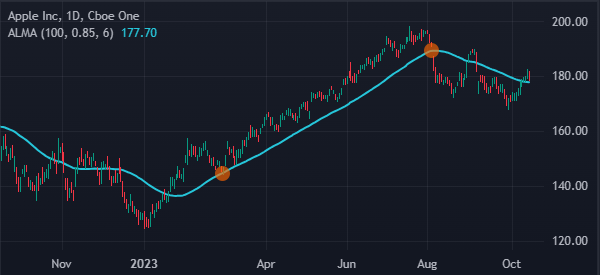
A good example of this is shown in the chart below. In it, we see that the stock was in a bullish trend for a while. It remained above the 50-day ALMA indicator. In this case, a trader would have placed a bearish trade when it moved below the 50-day ALMA. The trader would then hold the trade.
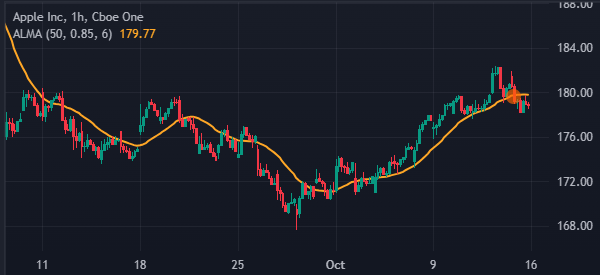
Support and resistance
The other ALMA trading strategy is known as support and resistance. A support is seen as a floor of an asset while a resistance is the ceiling. In most periods, you can use the moving averages to find support and resistance levels.
As shown above, the Apple shares struggled to move below the ascending 50-day moving average. This means that the average was the support. As such, a move below this support is a sign to exit the trade.
Pros and cons of ALMA indicator
There are several pros and cons of using the ALMA indicator.
Pros
- Simple to use – The ALMA indicator is an extremely easy tool to use, as shown above.
- Reduces the lag – It reduces the lag that exists across other moving averages like the simple and volume-weighted moving average.
- Different market conditions – The indicator is also useful in different market conditions including during trends and volatile markets.
Cons
- Hard to calculate – The ALMA indicator is relatively difficult to calculate, as mentioned above.
- False signals – Like other indicators, it can lead to false signals.
FAQs
What are some ALMA risk management strategies?
Some of the top Arnaud Legoux Moving Average (ALMA) risk management strategies are adding stop-loss and take-profit, position sizing, using limited leverage, and combining it with other indicators.
Can you combine ALMA with other tools?
Yes, you can combine the ALMA indicator with other technical indicators like the Relative Strength Index (RSI) and the MACD. Also, it makes sense to add other tools like the Fibonacci Retracement and Andrews Pitchfork.
Can you use other chart patterns?
Yes, you can use other chart patterns like head and shoulders, rising and falling wedges, and triangles.
External useful resources
- 5 Strategies for Day Trading with the Arnaud Legoux Moving Average – TradingSim

