Volume Spread Analysis is one of the most important concepts of technical analysis. This concept has been clarified by Dr Alexander Elder, one of the biggest developers of technical tools and authoring a number of top-selling financial books. Two of his most successful books are the new trading for a living and come to my trading room.
The consensus in his writing is that volume plays a very important role for traders. It is one of the key movers of the market because the market is mostly moved by fear and greed among the participants. Volume is also important in confirming a trend and chart patterns.
In this article, We will look at the 5 key concepts of volume spread analysis.
Table of Contents
What is volume spread analysis?
Volume is the amount of an asset that is being traded in a given time. For example, if 10,000 shares of Apple are bought and sold in a given day, this is known as volume. If the volume drops to 8,000 the following day, you can say that the volume has declined.
A spread, on the other hand, is the difference between two things. A common definition of a spread in forex trading is the difference between the bid and ask price of a pair.
For example, if the AUD/CAD has a bid of 0.91420 and an ask of 0.92426, the spread is about about 20. There are many examples of a spread. For example, if the price of Brent is trading at $85 and WTI is trading at $80, the spread is $5.
Volume spread analysis is a method of analysis that looks at candles and the volume per candle to determine price direction. It looks at the quantity of volume per candle, range spread, and the closing price.
How to spot VSA
There are several steps you need to follow when trading volume spread analysis. First, you need to ensure that you are using candlesticks to trade. It does not work well when you use other chart types like line, bar, and renko charts.
Second, you need to ensure that the broker offers reliable volume. Finally, you should pay a close attention to the timeframe of the chart. In most cases, volume analysis on a very short timeframe like a minute chart won’t make sense. We recommend that you use daily, weekly, or monthly chart.
One more tips; You should look at the spread between the price bars and the volume bars and see the trend.
The key concepts of volume spread analysis
#1 – Accumulation
Accumulation is the first stage in understanding volume price analysis. A good example of understanding assuming that you are an entrepreneur who sells shaving blades. To make more sales, you will need to market the products and showcase their competitive advantage against the peers. You can use any marketing concepts available.
Before you do this, you need to ensure that you have enough products to sell because if you don’t, the campaign will not achieve its goal. In the marketing mix, this is known as Place.
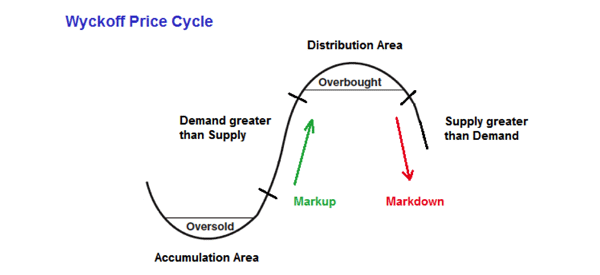
In volume spread analysis (VSA), this is known as accumulation where the insiders fill up their ‘warehouses’ thus increasing the ownership of the assets. As the insiders buy, the price of the assets (such as shares) will continue to fall.
The media is a powerful tool used by the insiders to encourage the owners of the assets to sell. As a result, in the accumulation phase, the price falls while the volume increases.
Related » The Best News Sources for Trading
#2 – Distribution
Now that the insiders have achieved their goal of reducing the price and increasing their holdings, the next phase is known as the distribution.
In this stage, since the insiders already own the assets, they start to move the market up. Once again, the media plays an important role in hyping the assets owned by the insiders. In response, the assets whose price had declined greatly now starts to rise.
The rise begins fast before becoming gradual with time as the insiders figure out their next course of action.
#3 – Testing Supply
The insiders now have their stores empty. To ordinary people, they would now start to go in the first stage and accumulate. Wrong! The insiders are wiser than that. Before they go back to the first stage, they test the market.
They test because they don’t want to continue buying and then be met with a new wave of selling from retail investors. They don’t want that. In testing, the insiders start a minor selling campaign where they sell low volumes of the assets with the aim of creating demand and moving the price up.
#4 – Testing demand
If the supply test goes as planned by the insiders, the next stage is to test the demand. At this stage, the last thing the insiders want is to start a campaign to fill their warehouses, move back into an area which has high demand thus pushing the market in the opposite direction. To avoid this situation, they deploy a test.
This test is intended to ensure the demand pressure has been absorbed in the distribution phase. Also, at this phase, the insiders have already moved the price from the wholesale price to their target retail level. After this test of demand is complete, they start a new wave of selling pushing the price lower.
#5 – The Selling Climax
In the first stage, the retail investors are selling while the insiders are buying. The insiders are the large investors and hedge funds who have knowledge on the company. They work hand in hand with their investment bankers.
While insider trading is a criminal offense, retail investors have been deluded that it does not exist. The fact is that insider trading where investment banks and company executives leak information to their clients is alive and well.
So, in this stage, the insiders start a selling campaign using the media as their mouthpiece. They push the price down and start the first stage once again.
» Related: How to do news trading
Volume spread analysis trading strategy
The best trading strategy for VSA involves four main steps:
- First, identify an existing trend.
- Second, note signs of weakness of the asset. This can be a situation where it is forming a bearish divergence pattern.
- Third, wait for a confirmation that the trend is ending.
- Finally, use price action patterns to place a trade.
Volume spread vs Wyckoff method
We have looked at what volume spread is in day trading and investing. A common question is on the difference between the approach with the Wyckoff theory.
The Wyckoff approach follows 5 key steps. First, you should determine the present position and probable future trend. Second, select stocks that will move in harmony with the trend.
Third, select stocks that have a cause that equals or exceeds the minimum objective. Fourth, identify stocks that have a readiness to move. And finally, time your commitment with a turn in the stock market.

By looking at these steps, Wyckoff identified the stages that stocks and other assets go through.
Volume Spread Analysis – Useful Links
- Discover how to start with Volume Spread Analysis on TradingSetupsReview


