Traders use various approaches to predict the future direction of a financial asset. One of the most common approaches is technical analysis, where they use various indicators to make predictions. Another approach is known as price action.
In price action, they observe various patterns in the market and use this information to make predictions. In this strategy, they use technical indicators like moving averages sparingly. One of the common price action strategies is the use of triangles.
In this article, we will look at the concept of triangles and help you decide on how you can use them. We will also look at the three types of triangles in the financial market, including the ascending, descending, and symmetrical triangle patterns.
Table of Contents
Triangle Patterns in day Trading
Triangle patterns are named so because of their shapes. As you already know, a triangle has three sides. The goal for traders is to identify a scenario where a triangle is forming and then use the information to know how to trade.
The pattern happens mid-trend as bulls and bears battle it out in the next direction of a trend. Ideally, triangle patterns are used to identify areas of potential breakouts.
They are also seen when there is indecision among the broad market participants. This indecision happens because the market is not sure of how the asset will move up.
Broadly, there are three types of triangles in the financial market: horizontal, ascending, and descending triangles.
Related » Trading Breakouts – 3 Key Ways To Be Successful
Ascending and descending triangles are signs of continuation
There are two main types of charts in the market: continuation and reversals. A continuation pattern is one that happens during a trend. When it happens, it raises the possibility that the asset will continue in the existing trend.
Other popular continuation patterns are bullish and bearish flags and bullish and bearish pennants. Ascending and descending triangle patterns are signs of continuations.
A reversal pattern is one that points to a change of direction. The most popular of these patterns are head and shoulders, double and triple tops, and rising and falling wedges.
How to Draw Triangles
While it is possible to identify these patterns visually, it is always important to use the trendline features to draw them.
Drawing triangles in the financial market is very easy. First, you need to ensure that you are using candlestick patterns. It is almost impossible to identify triangles when you are using bar charts, line charts, and other types of charts.
Second, you need to draw two trend lines. To do this, you need to connect the highest points of an asset. You will have a triangle pattern if the two lines form a pattern that looks like a triangle.
Horizontal Triangle Pattern
This pattern happens when there is a big drop or spike on a financial asset. After this happens, the asset tries to recover but then it finds significant challenge.
As a result, when you connect the higher lives and the lower levels, you will have a triangle pattern. A good example of this is shown on the chart below.
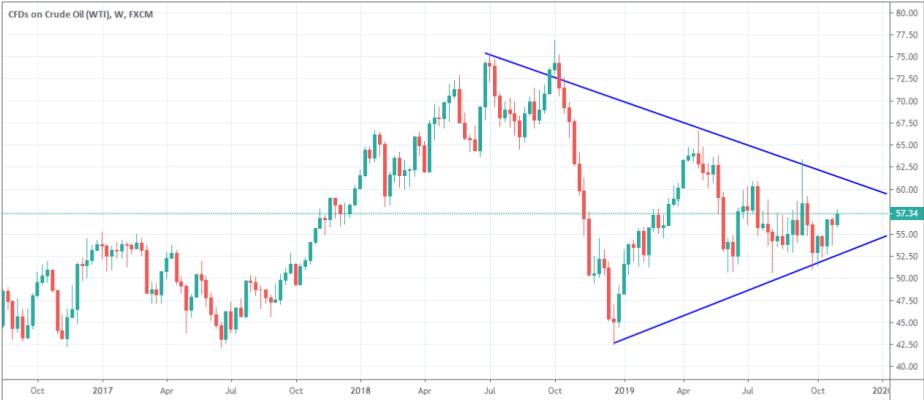
As you can see, the price of crude oil is struggling to move past the declining and ascending levels. As a result, a triangle pattern is formed.
You need, as a trader, to wait until the pair approaches the tip (usually seen as a breakout point).
When this happens, you will have higher chances of seeing a major breakout. This breakout could happen in either direction. In most cases, it happens before major information is released.
Ascending Triangle Pattern
An ascending triangle happens when a financial asset is moving higher but then finds resistance. You draw it by joining lower points and the point where it forms a resistance. A good example of this is shown on the chart below.
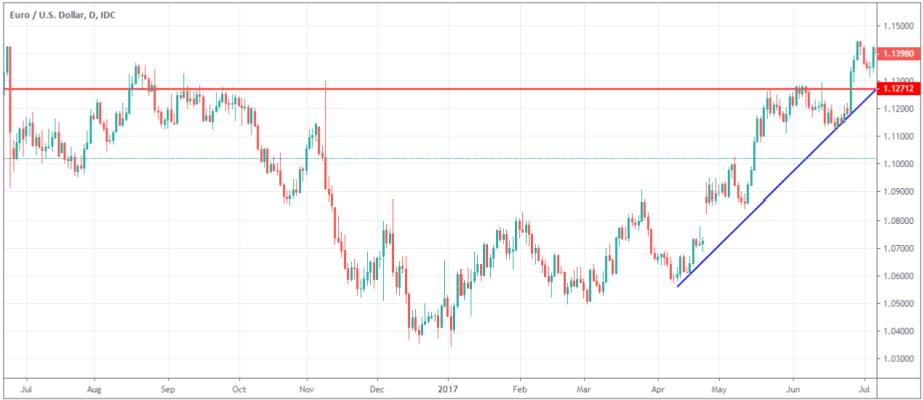
The ascending triangle pattern when bulls start to worry about the upward direction of the asset. As they do this, they find some significant resistance.
When an ascending triangle pattern happens, the likely scenario is that the asset breaks out higher.
Descending Triangle Pattern
Descending triangle is the opposite of an ascending triangle. It happens when a pair finds support when it is moving downwards. It is drawn in a similar method as an ascending triangle.
A good example of this type of triangle is shown below.
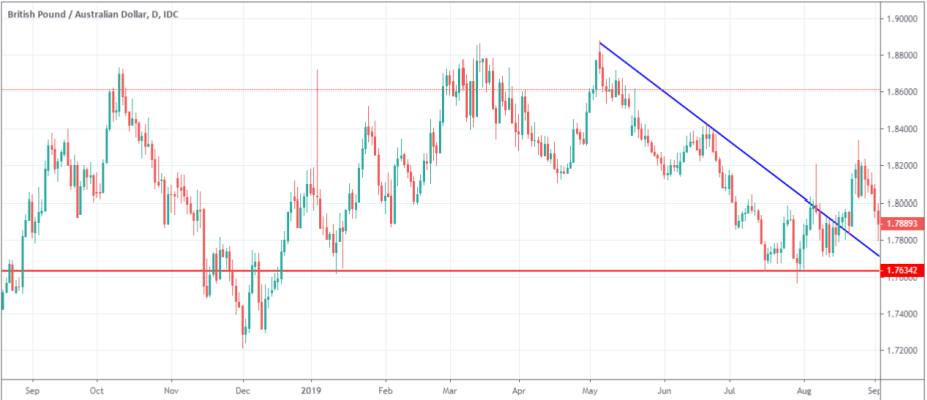
In most cases, a descending triangle pattern usually breaks out downwards.
Symmetrical triangle pattern
A symmetrical triangle pattern is relatively different from the ascending and descending triangles. It is usually a sign of consolidation in a financial asset. It is drawn by connecting two diagonal trendlines, with the result being a pointed pattern.
The ascending and descending triangle patterns are usually relatively easy to predict. That’s because, in most cases, an ascending triangle pattern usually breaks out higher while a descending triangle pattern tends to break out lower.
However, the symmetrical triangle has no defined thesis. Instead, it can break-out in either direction.
How to trade the triangle patterns
Trading the triangle patterns is a relatively easy process. In the previous sections, we have shown you how to draw the three types of triangles. We have also written that ascending and descending triangles tend to break out higher and lower, respectively. Further, the symmetrical triangle can break out in either direction.
However, like all chart patterns, the triangle patterns are not always perfect. Therefore, you should always be careful when using the patterns in day trading.
We recommend that you use pending orders like the buy and sell stops and buy and sell limits. For example, in an ascending triangle, you should place a buy stop above the upper resistance. In case of a bullish breakout, the buy stop will be triggered.
Related » Stop Order vs Stop Limit Order
Similarly, in a descending triangle, you should place a sell-stop below the support level. For a symmetrical triangle, you should have a buy and sell stop at key support and resistance levels.
Practical Examples
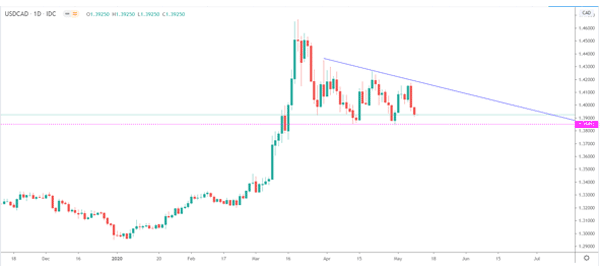
The chart below shows a good example of a descending triangle pattern on the USD/CAD pair. As you can see, the pair found important support at the 1.3848 level.
As the price climbed, it found some resistance, which is an indication that there were not enough buyers to push it higher.
Therefore, this pattern means that the pair will break lower.
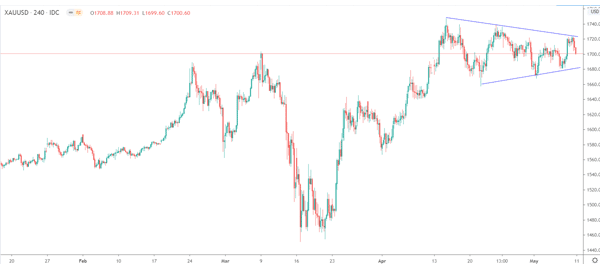
Another example of a symmetrical triangle pattern is shown on the four-hour XAU/USD chart shown below.
As you can see, it seems like there is indecision between buyers and sellers. Because the price was previously in an uptrend, the arrangement suggests that the price will break out higher.
Identifying profit targets in triangle
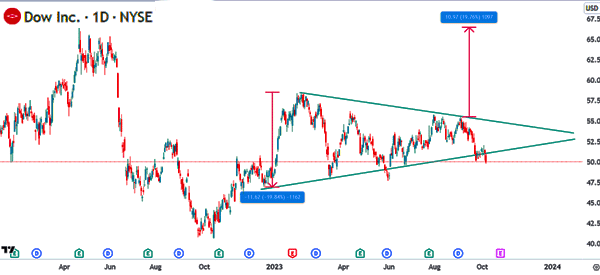
The next important aspect of trading a triangle pattern is where to place the profit target. In most periods, traders first connect the starting parts of the triangle pattern as shown below. Then, you should draw the same line from the three-quarters of the triangle pattern to the expected direction of the breakout.
While this price is the target, many people tend to be highly conservative. As such, they place the target halfway.
Advantages of the triangles pattern
There are several benefits of using triangle patterns when trading. First, the patterns are usually easy to spot, even among new traders. Second, drawing the triangle patterns is usually relatively easy as you have seen above.
Finally, you don’t need to use technical indicators to use the triangle pattern well.
Conclusion
When using triangle patterns, it is important to do several things. First, it is important that you use them in combination with other technical indicators. Doing this will help you avoid being in a false breakout.
Second, it is important that you use a stop loss to protect you from a major reversal. Finally, you need to be patient and wait for a breakout.
External Useful Resources
- How could you recognize the difference in shapes between a pennant and triangle? – Quora
- Discussions about triangles – Tradingview


