

Gaps are important parts of the financial market, especially in stocks and currencies. They happen when an asset opens at a significantly lower or higher price than where it closed at.
Just take a look at any chart of any asset and you will see there are plenty of them. An excellent opportunity to understand and use to one’s advantage, don’t you think?
In this article, we will explain what gaps are, how they work, how they happen and how to trade them.
Table of Contents
What is a gap in trading?
As stated above, a gap is a situation where a stock or any other asset opens sharply lower or higher than where it closed the previous day. Such a gap happens when there is a major event or news when the markets are closed.
It usually represents an area where there is no trading taking place.
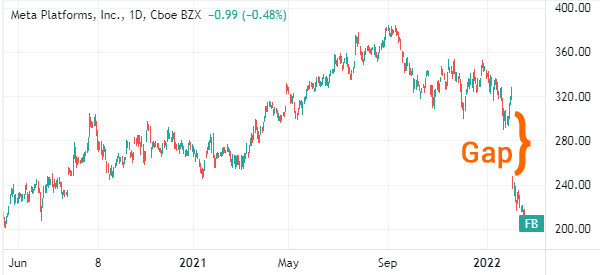
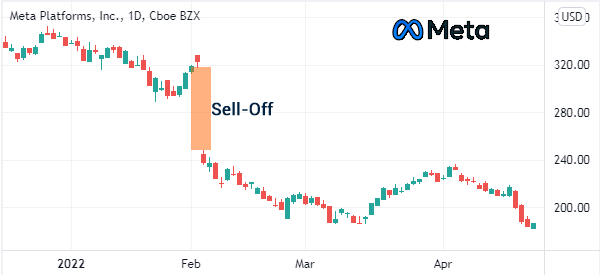
A good example of a gap is when a stock ends the day at $10 and then opens the following day at $13. A real-life example of a gap is shown in the chart below.
It shows that Meta’s stock closed at $321 and then opened at $248 the following day when the company published weak quarterly results.
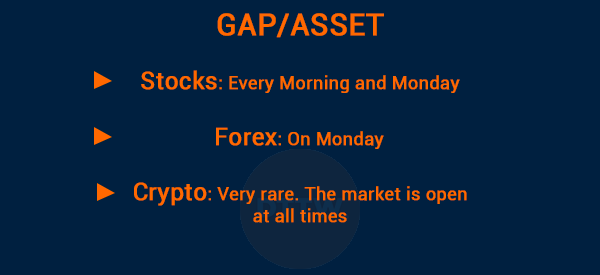
Gaps also happen in other assets. For example, in forex, gaps usually happen when the market opens on Monday. Cryptocurrencies, on the other hand, rarely have gaps since the market is usually open at all times.
Types of gaps
There are broadly four main types of gaps in the market.
- Breakaway gap – This is a gap that happens after a breakout. For example, if a stock price has been consolidating at $10 and $11, a breakaway gap can happen when it suddenly rises to $15.
- Pattern gap – This type of a gap is also known as a common gap. It forms when a price is consolidating at a certain range. In most cases, this gap is usually filled within a short time.
- Exhaustion gap – This is a gap that is formed after a long period of a trend. For example, if an asset is in a strong bullish trend, it can form a bearish gap as the trend ends.
- Measuring gap – Commonly known as a runaway gap, it tends to form in halfway of a price move.
What does a gap tell you?
A common question is on what a gap tells traders and investors in the market. In most cases, a gap tells market participants that conditions are changing and that there was a major event that affected a certain asset. Some of the most common causes of gaps are:
- Earnings – Gaps happen mostly during the earnings season when a company publishes its results. A bullish gap will form when a company publishes strong results while a bearish gap will form when it publishes weak results.
- M&A deal – A gap can happen when there is an M&A. For example, when a company is being acquired, its stock price will soar to get to the premium price. This gap is usually followed by a period of consolidation.
- Investigation – At times, a stock can open sharply lower when a major investigation by the Justice Department is launched. In other periods, it can open higher when an ongoing investigation ends.
- Fed actions – The Fed can lead to a gap in stocks and other assets. If the bank makes an emergency announcement, stocks can open sharply higher or lower.
There are other causes of gaps such as geopolitical events, monetary policy, and natural disasters.
How to find gaps
The easiest way to find gaps is to find pre market movers. In most cases, companies that are in this list tend to open with a major gap.
Related » Pre market trading explained
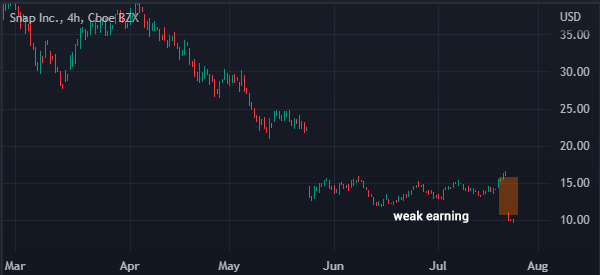
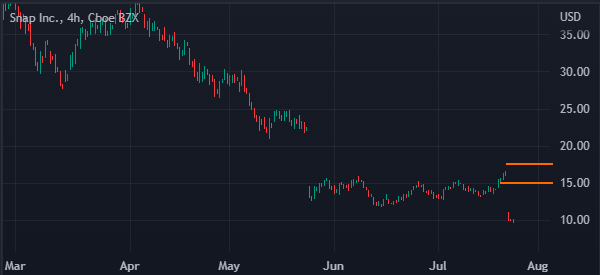
For example, at the end of July, Snap was one of the premarket movers. As shown below, the stock made a major down gap after the firm published weak results.
Another way to find gaps in the market is to find companies that are making headlines before the market opens. Subscribing to a free watch list can help you find these companies.
What happens after a gap forms?
There are three main scenarios that happen after a gap in the market forms.
First, an asset price can continue moving in the direction of the gap. For example, when a bullish gap forms, an asset’s price can continue with that trend. For example, in the chart above, we see that Meta platform’s stock continued falling after its bearish gap.
Second, a gap can be filled within a few days or months. For example, in the chart below, we see that DocuSign’s stock made a bearish gap, which was then filled quickly.
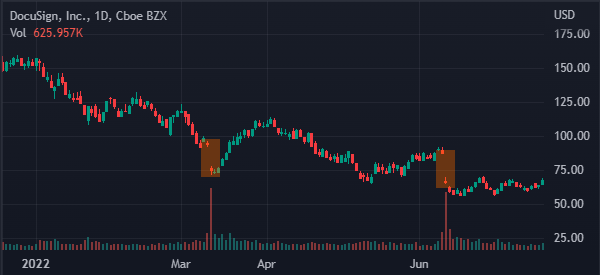
Finally, a gap can be followed by a long period of consolidation as traders focus on the next major moves. In all these, it is always good to focus on the asset’s volume.
How to trade gaps
There are several strategies to trade gaps. The easiest strategy is to use the earnings calendar to find companies that will publish their results after the market closes.
After doing this, you should set a few pending orders before the market closes. In this case, the pending order will be triggered after the market happens.
Related » Gap & Go Strategy
A good example of this is shown in the chart below. As you can see, SNAP shares were trading at $16.45 before the market closed. Now, you can set a sell-stop at $15 and a buy stop at $17.67.
You can then protect the two trades with a take-profit and a trailing stop. In this case, the sell-stop would have been triggered when the stock made a down gap.
Fading the gap
The second trading strategy is known as fading the gap. This is where you decide to enter a trade in the opposite direction of the gap. In this case, you will be betting that the asset will reverse after forming a gap. Ideally, one way of doing this is to check the trends of volume after the gap happens.
Still, the risk of doing this is that the asset will either consolidate or resume the gap trend.
Multiple timeframe analysis
This is a strategy where you identify support and resistance levels on multiple timeframes and identify potential levels.
By doing this type of analysis, you will be able to identify whether the asset will continue rising or falling. For example, if the down-gap sees it cross the all-time low, there is a likelihood that the price will continue moving in the downward trend.
Summary
In this article, we have focused on the concept of gaps in the financial market. We have seen how they form and identified some of the strategies to use when trading. We have also explained how to use premarket data to find potential morning gappers and some of the major causes of these gaps.
External useful resources
- How To Apply Gap Theory in Technical Analysis – ELearnMarkets

