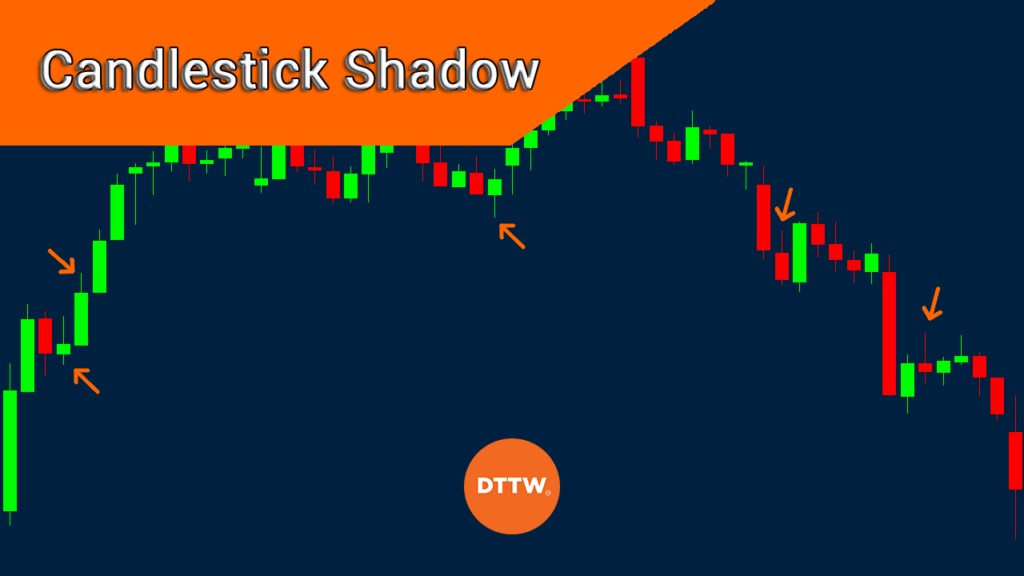
Candlesticks are the most popular chart types in day trading. They are better than other types of charts like line charts, bar charts, and kagi because of the vast amount of data they show.
In this article, we will look at what candlesticks are and what a shadow (or wick) of a candlestick reveals.
Table of Contents
What is a candlestick?
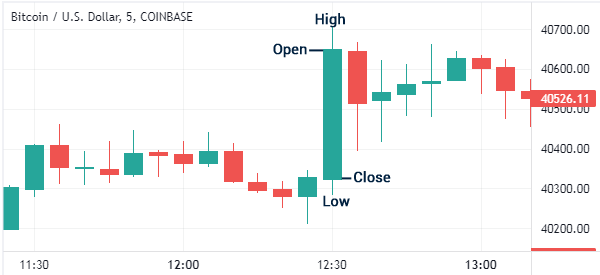
A candlestick is an ancient type of chart that shows four things that are useful to traders and investors. A single candlestick shows the Open, High, Low, and Close of an asset.
Open is the price where an asset starts a certain period. As such, in a daily chart, open is the price where the asset starts in a given day. Similarly, in a weekly chart, the open is where the price starts the week.
High is the highest price during a certain session while low is the lowest level that the price dropped to. Close is the price where the asset closed in a given period.
The chart below shows the OHLC of Bitcoin in a one-minute chart.
Parts of a candlestick
A candlestick has two main parts. The first one is known as the body. The body is the area that separates the open and closing prices.
In the chart above, the red body means that the asset’s price declined while the green body signals that the asset’s price rose in that period. By default, most chart platforms use red and green colors although it is possible for one to tweak them when needed.
The second part of the candlestick is known as a wick or a shadow. These two parts show the extreme levels of the asset. The upper shadow shows the asset’s highest point in a certain time while the lower shadow shows the lowest level of that price.
It is worth noting that some candlesticks don’t have upper and lower shadows. Instead, they only have a body, signaling that it closed and opened at the same price. At times, the price can have a long upper and lower shadow and a tiny body.
What is the shadow of a candlestick?
As described above, the shadow of a candlestick refers to the upper and lower lines that happen in a chart. These shadows are used to show the highest and lowest prices of an asset in a chart. An upper shadow illustrates the highest point while the lower shadow shows the lowest point.
The length of the shadow can be long or short depending on market conditions. In a high-volatile market, the shadows will typically be long while in a low-volatile market, the shadows will often be small.
Meaning of a long and short candlestick shadow
A common question among traders is on the meaning of a long and short candlestick shadow.
Ideally, when a candlestick has a long upper and lower shadow, it is usually a sign that substantial volatility happened in that period. It means that the asset opened and then rose and fell sharply in that period.
A good example of this situation is shown in the chart below.
As you can see, in this candlestick, the price rose to a high of $44,288 and then moved to a low of $43,172. Since this is a 30-minute chart, it means that the spread between the high and low prices is $1,116. As such, Bitcoin lost this amount in this period.
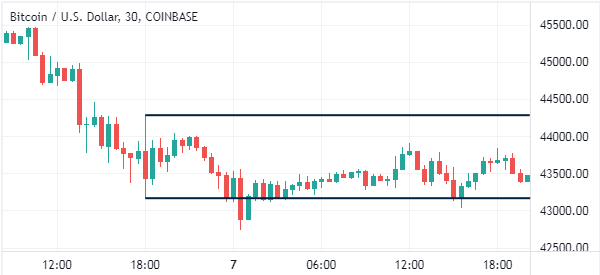
Short candlestick shadows, on the other hand, are signs that the price did not have substantial volatility in a given period.
» Related: How to Day Trade Profitably in Periods of Low Volatility
Candlestick with no shadows
Another scenario is where a candlestick has no upper shadow or an upper shadow. In most cases, this scenario does not mean anything. As shown below, this market condition usually shows that the asset’s open was its lowest level while the upper side was its closing price.
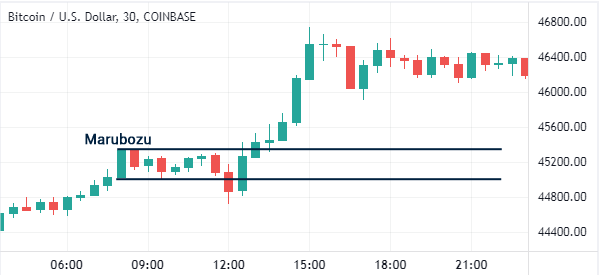
However, in some cases, can be a sign of consolidation in the market because traders are unsure whether the price will keep rising or falling. You can read more about this Marubozu pattern here.
Types of candlesticks by shadow
There are several types of candlesticks when you consider the shadow. Examples of these are:
- Gravestone Doji – This is a pattern where the financial asset has a very small body and a long upper shadow. In most cases, when this happens, it is usually a sign of a reversal.
- Dragonfly doji – This is a pattern where the asset’s price has a very tiny body and a long lower shadow.
- Long-legged doji – This is a situation where the asset has a very small body and upper shadow and an extremely long lower shadow.
- Standard doji – This is where the price has a long upper and lower shadows and a very tiny body.
Strategies for trading candlestick shadows
In most cases, there is usually no strategy for trading the candlestick dojis. Besides, an asset forms these shadows all the time. Still, there are several strategies that one can use.
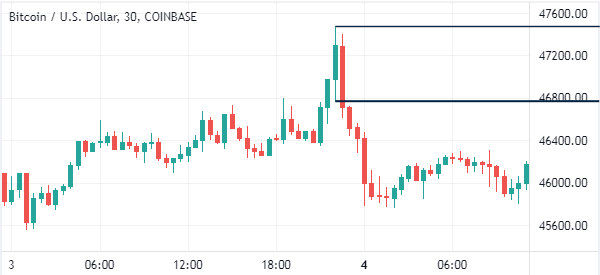
For example, in case shown below where an asset forms a long upper and lower shadow, one can use pending orders. In the example below, one can use a sell-stop at $46,773 and a buy-stop at $47,472.
In this case, a trade will be triggered depending on how a breakout happens. In this case, the sell-stop pattern was triggered, leading to major gains for short-sellers,
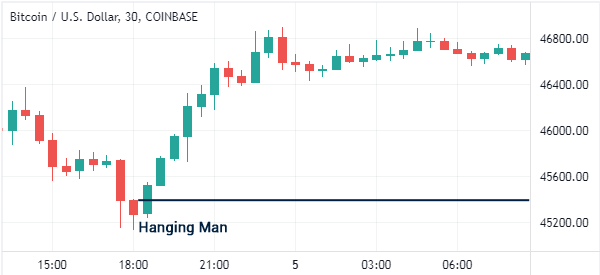
Another approach is to use the hanging man candlestick pattern. This is a pattern that has a long lower shadow and a small body.
In most cases, when this pattern happens, it is usually a sign of a reversal. Therefore, in this case, you could initiate a buy-stop above the upper body. A good example is shown in the chart below.
Final thoughts
We get it: What may appear to be a minor element at first glance, the shadow of a candlestick, is a much more relevant factor. After that, the type of candlestick changes depending on the length of the wick.
In this article, we have looked at what shadows are in trading and some strategies for using them. In most cases, you should always use them in combination with other patterns and technical indicators.
External useful resources
- What is the use of shadows in a candlestick pattern? – Quora


