

A pullback is an important part for any day trader and investor in that it helps them implement buy and even short positions. It is defined as a temporary reversal in the upside price of a financial security.
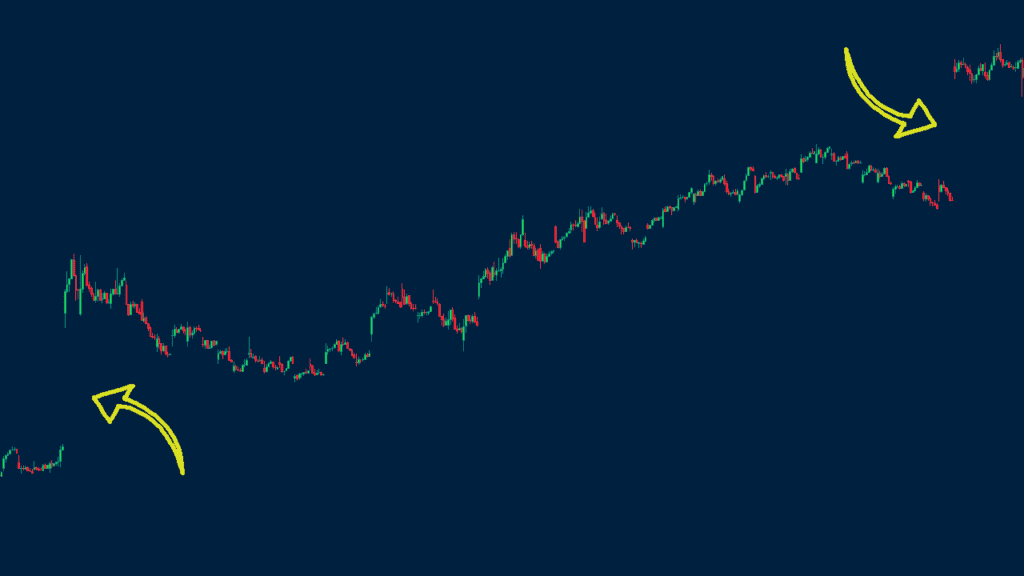
These pullbacks happen because financial assets like stocks and commodities rarely move in a straight line. Even in a strong uptrend, assets will often have some temporary pullbacks before resuming the uptrend.
These are golden opportunities for a day trader, as you can take advantage of these fluctuations to generate profits. That’s why we want to show you how to spot these pullbacks as early as possible and some strategies for entering/exiting the trade.
Table of Contents
What is the trend-following strategy?
The best trading strategy is known as trend-following. It involves buying a financial asset when the price is rising and holding the position to the end.
Trend followers rarely attempt to time the market or identify reversals. Instead, they believe in implementing trades that are in line with the existing trend.
A good example of a trend-following strategy that worked well was in 2023 when Meta Platforms stock jumped as shown below.
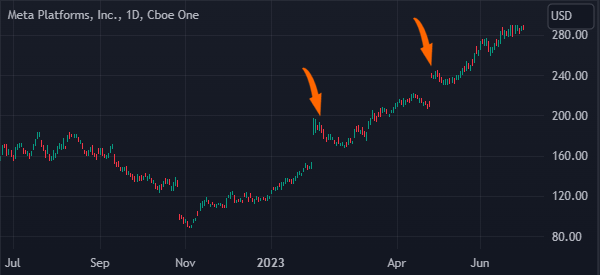
At the time, traders who bought and held their positions were the most profitable. Those who tried to time the market by shorting in an uptrend experienced substantial losses.
Define a pullback
A financial asset does not always move in a straight line. Even when an asset is in a strong bullish trend, an asset always makes some small retreats. In the chart above, we see that Meta Platforms shares had some pullbacks as its price rose from $88.30 to almost $300.
In most periods, a pullback is usually a temporary move during an uptrend or a downtrend. In other periods a pullback can turn into a reversal.
Pullbacks happen for several reasons. First, they happen as some of the existing buyers start taking profit in the market. In Meta’s case, some people who bought at $88 started exiting their positions when the price reached key resistance levels like $100, $200, and $250
Second, pullbacks happen when an asset gets a bit overbought. In such a period, they happen for technical reasons. Third, they happen as some investors and traders start betting on a reversal. A reversal is a period when an asset moving in a certain direction suddenly changes direction.
Strategies to trade pullbacks
Day traders and investors use several strategies to trade pullbacks. The goal is usually to buy an asset when it reaches a certain level and then hold the recovery. Let us look at some of these popular trading approaches.
Moving averages strategy
Moving averages are the most popular indicators in the market. They look at the average price of an asset in a certain duration. As we have looked at before, there are numerous types of MAs, including:
- Exponential
- Smoothed
- Simple
- Least square
- Weighted
among others. All these moving averages are used in the same way.
The first stage to using moving averages is to identify one or two periods that work well and then using them to identify positions. The best way to explain this is using an example.
As shown below, the Meta Platforms was in an uptrend. In this chart, we have applied the 25-day and 50-day exponential moving averages (EMA) indicators. As you can see, the stock remained above the 25-day moving average. All pullbacks struggled moving below this level.
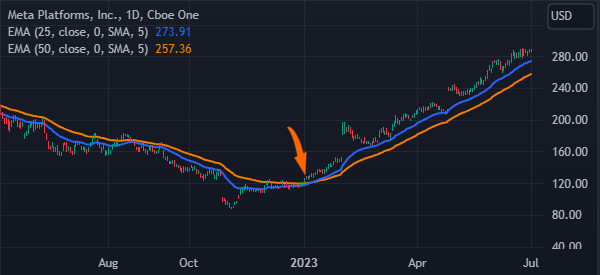
Therefore, a trader without a position would have placed a buy trade when it moved to the 25-day moving average. On the other hand, a trader with a position would have continued holding the trade as long as it was above the moving average.
Horizontal steps
Another popular strategy to trade pullbacks is known as horizontal steps. This is a situation where an asset forms what resembles horizontal double-tops during an uptrend. A trader can use these horizontal steps in several ways. First, if the price holds above the horizontal steps, it can be a good way to buy the dip.
Second, if it moves below the steps in a high-volume environment, it is a sign that this is not a pullback but a complete reversal. Further, many traders use the horizontal steps together with other trend indicators like moving averages. A good example of horizontal steps is shown in the EUR/USD chart below.
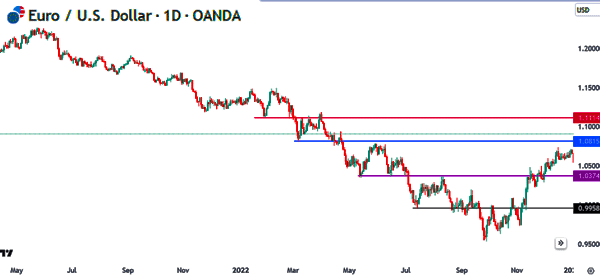
In this chart, we see that the EUR/USD pair was in a bearish trend. As it dropped, the pair formed several horizontal steps shown in red, blue, purple, and black. As such, a trader would have placed a sell trade when it rose to these horizontal steps and benefited as the prices dropped.
Trendlines
The other simple pullback trading strategy is known as trendlines. A trendline is a line that connects several swings. Most charting platforms like TradingView and MetaTrader have a drawing tool that can help you connect these levels.
The concept of using trendlines is relatively simple. In a downtrend, if the price moves below the trendline, it indicates a continuation of the downtrend. However, if the price moves above the upper side of the trendline, it is a sign that the downtrend is ending and a potential trend reversal may occur.
This breach of the trendline resistance suggests that buyers are gaining strength, potentially leading to a new uptrend. Traders often look for confirmation signals, such as increased trading volume or the formation of bullish chart patterns, to validate the trend reversal and consider entering long positions.
An example of this is shown in the EUR/USD pair below. As you can see, the price made a perfect channel, which is made by connecting the lower and upper swings.
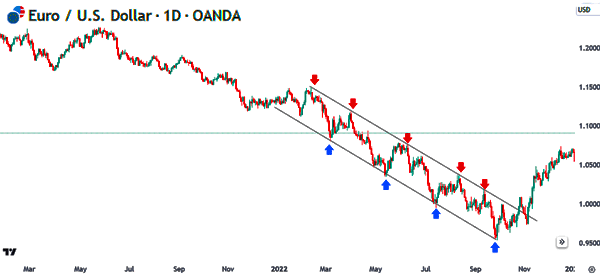
In this case, a trader should have bought the pair when it moved to the lower side of the channel and then shorted it when it moved to the upper side of the channel.
Fibonacci Retracement
The other popular pullback trading strategy is known as the Fibonacci Retracement. This is a popular tool that looks at the key Fibonacci levels of an asset. It is drawn by connecting the upper and lower of a financial asset.
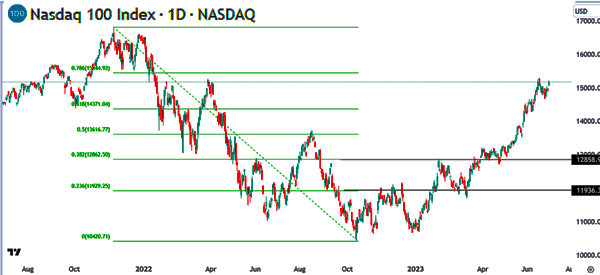
The Fibonacci tool is made up of several important levels like the 23.6%, 38.2%, 50%, 61.8%, and 78.6% levels. In most periods, an asset tends to waver when it hits the Fibonacci level. In other periods, the price tends to retreat and retest the previous Fibonacci level.
For example, in the chart below, we see that the stock rose to the 38.2% retracement level and then retreated to the 23.6% retracement point. In this case, a buyer could have placed a buy trade when it dropped to the 23.6% retracement point.
Summary
In this article, we have looked at what a pullback is and how to use it in the financial market. We have also looked at the important strategies to use when trading pullbacks.
These popular approaches are trendlines, moving averages, and Fibonacci Retracement levels. Day traders can use these strategies – some even in combination with each other – to quickly spot the pullback and be able to exploit it as much as possible.
External useful resources
- Pullback Trading: 7 Factors to Consider Before Placing a Trade – Colibri Trader

