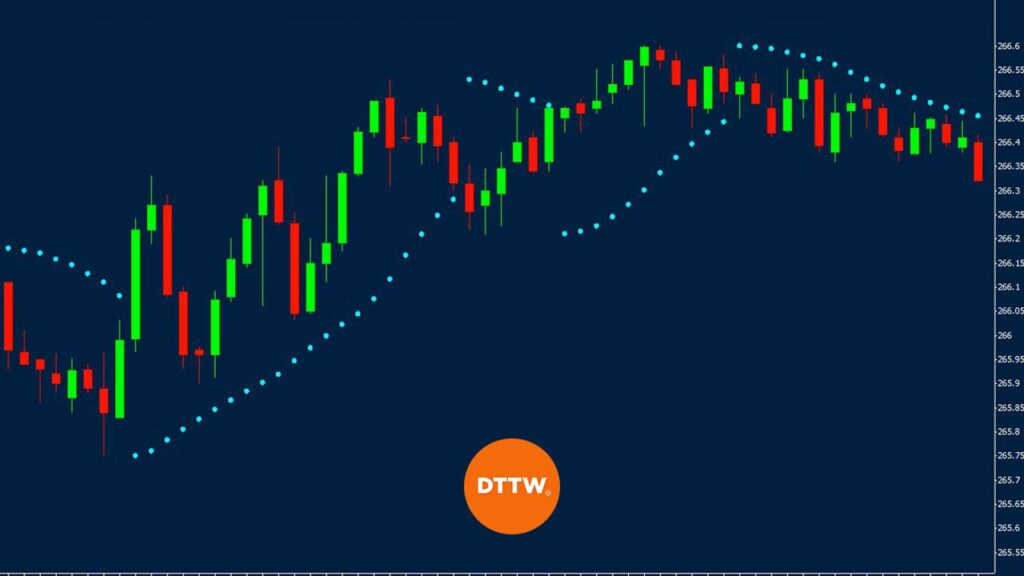
Trend indicators are among the most important indicators in the financial markets. You have likely heard about indicators like moving averages, the average directional movement index, and standard deviation. These are very popular, especially if you watch financial media regularly.
The Parabolic SAR is another trend indicator that is very popular also. It is also among the most different indicator because of its appearance.
In this article, we will look at the Parabolic SAR and how to use it.
Table of Contents
What is a Parabolic SAR?
The Parabolic SAR is a trend following indicator that was developed by Welles Wilder. As we had explained before, trend indicators are lagging indicators because they use historical data to help forecast the future.
The SAR stands for stop and reverse.
As with other trend oscillators, and volume indicators, it is not important for you to know how the indicator is calculated. However, if you want to get to know more about the indicator, the following is the formula.
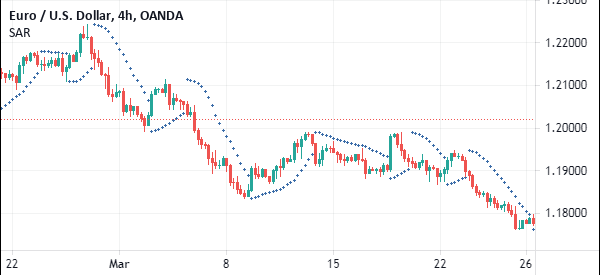
The chart below is a good example of how this indicator is applied on the EUR/USD chart.
Stop and Reverse Formula
First, you need to calculate the prior SAR, the extreme point, and the acceleration factor.
The prior SAR is the SAR value for the previous period while the extreme point is the highest point of the current uptrend. The acceleration factor starts at 0.02 and increases by 0.02. As a result, the current SAR formula is calculated as follow:
| Current SAR = Prior SAR + Prior AF(Prior EP – Prior SAR) |
The falling SAR is calculated by using the same formula as the previous one.
Please note that, as a day trader, you don’t need to know how this calculation is done. Instead, you should only focus on the how to apply the indicator and use it well in an asset.
How to Use a Parabolic SAR Effectively
There are a few things that you need to know when using the Parabolic SAR. Also, ensure that you leave the parameters intact. Most trading platforms provide the default settings at the start at 0.02, increment at 0.02, and maximum value at 0.2. Some day traders, however, have developed their own parameters based on their trading strategy.
First, the indicator is only used when the market is trending. It would be wrong to use it when the market is ranging. In this period, the results you will see will probably be wrong.
Second, the indicator is only used when using candlesticks. It cannot be used well when using line and bar charts.
When you apply the SAR indicator, you will see dots as you can see on the chart below.
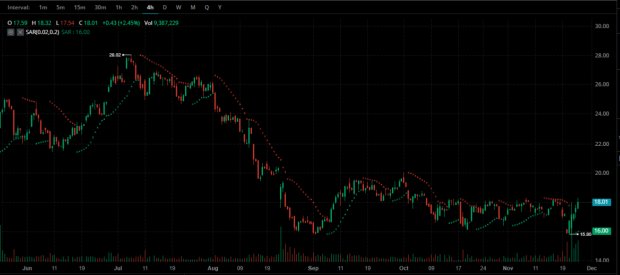
The interpretation is that the pair will continue moving lower when the dots are above the financial asset. As shown above, the red dots appear when the pair is moving lower.
This changes when the asset starts moving higher. When this happens, the dots on the asset change.
»How To Profit by Trading Parabolic Movers«
Parabolic SAR Strategy for Day Traders
Therefore, the Parabolic SAR is fairly simple to use. All you need to do is to apply it and see what it is indicating. You can tweak the acceleration factor and the acceleration limit. The default factor and limit are 0.02 and 0.2. Most traders prefer using the default numbers.
As with all indicators, there are several things that you need to know.
First, you can use the Parabolic SAR to know where to place the stop loss. Second, while this indicator can be used by itself, it is always recommended that you use it in combination with other tools like the Fibonacci Retracement.
You can find this Trend Indicator in our Ppro8
Using the Parabolic SAR for trend following
Trend following is a trading strategy where one buys an asset that is moving in an already-formed upward trend and shorts one that is in an already-formed downward trend. The goal is to follow the trend until the price starts to form a reversal.
The Parabolic SAR is one of the best indicators you can use when following the trend.
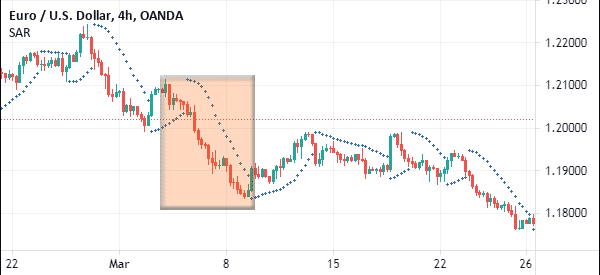
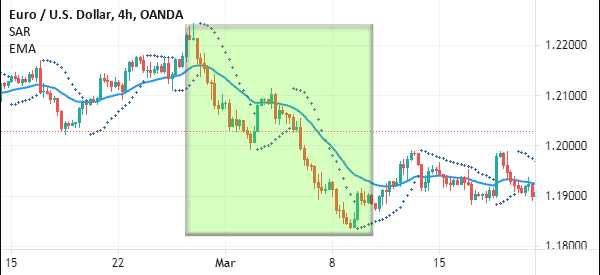
Ideally, if you are following a bullish trade, you will continue holding it until the Parabolic SAR moves above the price. Similarly, if you are following a falling asset, you should continue holding it until the Parabolic SAR moves below the price. This price action is shown in the chart below.
Combining with other indicators
As you can see in the previous charts, this indicator is not all that accurate when providing buying and selling signals. Therefore, most day traders use it in addition to other indicators. Some use the moving average and the Relative Strength Index (RSI) to validate the signal.
For example, in trend following, traders use moving averages to determine when a trend is about to reverse. Essentially, a reversal point is usually a point where the price moves above or below the moving average. Therefore, if the same thing happens on the Parabolic SAR, it is a sign that a reversal is about to happen.
Summary
The Parabolic SAR is a popular trend-following indicator that is used widely in the financial market. It is mostly used in trend following and in combination with other indicators like the Relative Strength Index (RSI) and the MACD. It is an easy-to use indicator and one that you can use in combination with other indicators.
External Useful Resources
- Technical SAR in-depth by Stock Charts
- How to use parabolic SAR in Forex – Babypips


