

Volume is an important part of the financial market since it determines the strength of a move in the financial market.
In most periods, market moves that are supported by volume are more effective than those with limited ones. Therefore, day traders use volume indicators when making decisions to figure out whether an asset is liquid or not.
In this article, we will delve into one of these indicators, the Negative Volume Index (NVI), moving on to understand how we can use it for our benefit when trading in the markets.
Table of Contents
What is the Negative Volume Index (NVI)?
The NVI is a little-known technical indicator that was created by Paul Dysart in the 1930s. Over the years, several iterations of his original goals have been suggested. The concept behind this tool is that it looks at the change in volume to decide when the smart money is active.
Smart money in the market refers to funds allocated by highly experienced people, including those in hedge funds and investment banks. These entities are believed to be highly learned and that they can influence the broader market.
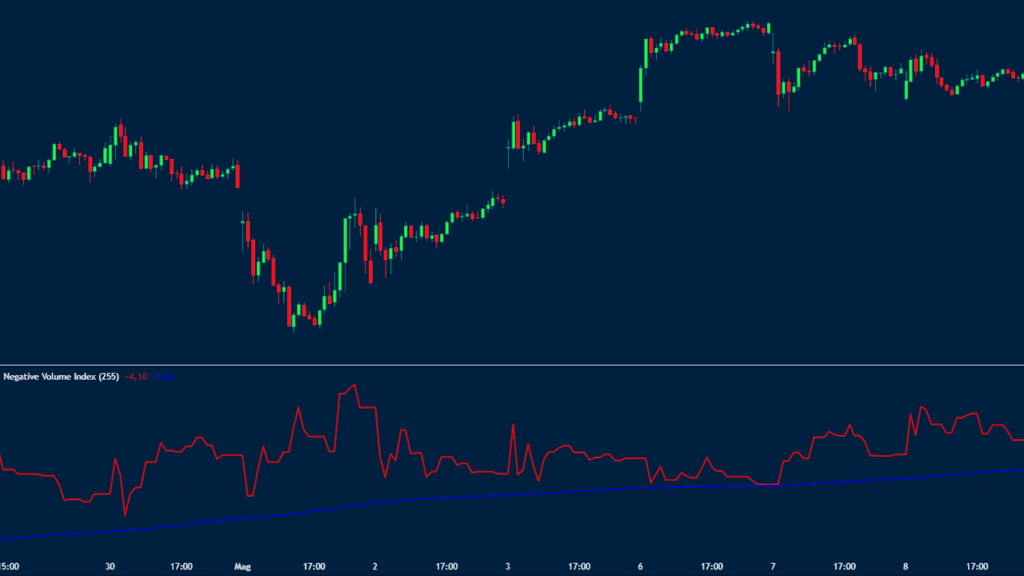
A key part of the Negative Volume Index is that it assumes that the smart money is more active in periods of low volume and vice versa. The chart below shows the NVI line in red and the EMA line shown in blue.
How the NVI index is calculated
Learning how technical indicators are derived is a good thing but it is not all that necessary since trading platforms like TradingView and MetaTrader provide them.
The Negative Volume indicator is calculated by adding the net advances. Net advances is defined as a period when the net volume dropped from one period to the next one.
As a result, the cumulative NVI line is usually unchanged when the volume increases from one period to the other.
There are different iterations of this indicator. First, as shown above, the NVI indicator has added the exponential moving average (EMA).
This EMA is ideal since it shows the strength of the NVI line. First, it is possible to substitute the percentage price change for net advances. So, this is how you calculate the indicator:
- First, set the start of the cumulative figure: It can start at 100 or 1000.
- Next, add the percentage price change to the cumulative NVI when the volume retreats.
- Finally, add a certain EMA line for signals. In most periods, people add a 255-day EMA.
The formula for the Negative Volume Index indicator is shown below:
NVIt = (Pt – P (t – 1) / P t-1 X NVI t-1
In this case NVIt is the negative volume index at time t and Pt is the price or the index level at time t.
The purpose of the Negative Volume Index is to look at the volume movements in an asset. These assets include stocks, cryptocurrencies, commodities, and bonds.
How NVI indicator works
As mentioned above, this indicator works in a relatively simple way where it looks at the volume of an asset. Its goal is to see the trends of the smart money in the market.
In this case, the indicator looks at the daily trading volume, making it less ideal for day traders. Instead, it is mostly used by swing traders and long-term investors.
The interpretation of the tool is equally simple. Experts believe that a bull market tends to happen more when the NVI indicator moves above the 255-moving average. Other experts believe that a bear market happens when the indicator is below the moving average.
Trading the NVI indicator and example
The NVI indicator works by looking at its interactions with the 255-day moving average. Therefore, because of its long-term nature, day traders don’t use it in most cases. Instead, they mostly use it when conducting a multi-timeframe analysis in the market.
Multi-timeframe analysis is a process where a trader looks at several time frames in a goal of identifying trends in the market. You can move from a daily chart then to a four-hour chart, followed by the hourly and 15-minute chart.
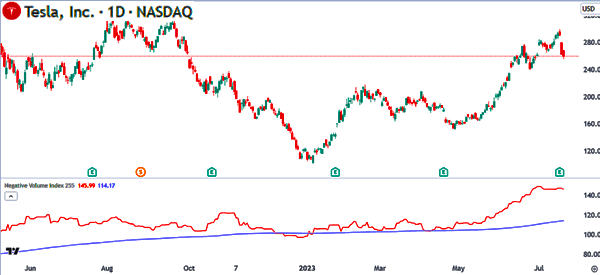
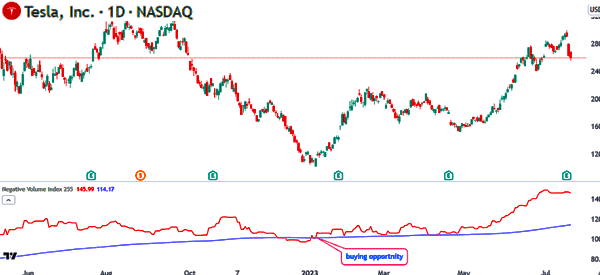
A good example of the toll at work is shown in the Tesla stock below. For a long-term investor, the best time to have bought the stock was on June 9th when the NVI indicator moved above the moving average.
Strategies for using the NVI indicator
As mentioned, the NVI indicator is not all that ideal for day traders. That’s because day traders use extremely short-term charts like one minute and five minutes. In this case, it would be hard for them to use it in the market.
Swing traders and long-term investors use the Negative Volume Index indicator by looking at its interaction with the exponential moving average (EMA). As mentioned above, they initiate a buy trade when it moves above the moving average and vice versa.
Another approach is to combine it with other indicators. In most cases, traders use trend indicators and oscillators to confirm trends. The most popular indicators you can use the NVI with are moving averages and Relative Strength Index (RSI).
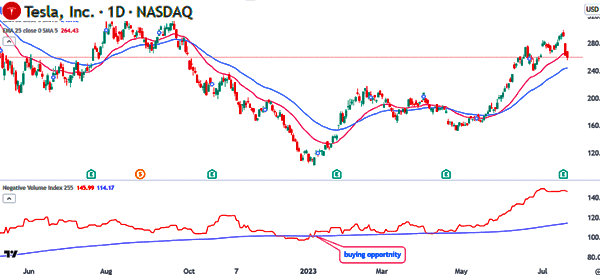
In the chart below, we see that the NVI moved above the 255-day moving average when the stock moved above the two moving averages.
Summary
In this article, we have looked at the important indicator known as the Negative Volume Index (NVI).
We have seen that the index looks at volume in the market and how it affects key assets like stocks. However, most day traders will not find it useful. Instead, it is more useful to investors and swing traders.
External useful resources
- Negative Volume Index (NVI) Explained – Corporate Financial Institute

