The stock market goes through different cycles. For example, the market went through a major bull run during the Covid-19 pandemic as the Fed supplied the US with trillions in liquidity. It then suffered a major bear market in 2021 and 2022 as the Fed embraced a more hawkish tone.
In this article, we will look at what a stock market cycle is and how to take advantage of it.
Table of Contents
What is a stock market cycle?
A stock market cycle refers to the two main stages that the stock market experiences. In most cases, these cycles are usually simplified as boom and bust.
A boom is a period when stocks are generally doing well. This happens when investors are generally optimistic about the market and are constantly buying equities.
A good example of a boom is what happened after the Global Financial Crisis in 2009. In the decade that followed, most investors made money by just buying the dip as stocks experienced one of the biggest rallies in history.
A bust, on the other hand, is a period when stocks moves into a major bear market. A bear market is defined as a period when major indices crash by more than 20% from their peak level.
A correction, on the other hand, is when they drop by about 10% from their peak.
Related » Is the Bear Market Condition Relevant for Day Traders?
Sector market cycles
In addition to the broad market cycle, there is a sector cycle. This happens to cycles that happen in several sectors in the market. For example, at times, companies in the technology industry can go through a major bullish cycle. This tends to happen in periods when interest rates are significantly low.

Another example is when commodity companies like those in mining and agricultural production usually in a bull run. This happens when commodity prices are broadly rising.
As their prices surge, many investors usually buy commodity stocks, which pushes their prices higher.
Why emotions matter
Earnings and the broader economy are important concepts in the market. However, in reality, emotions are the main driving force for the financial market. As we have looked at before, fear and greed are the two important concepts in the market.
For example, cryptocurrency prices surged during the pandemic as traders bought all coins since their prices were rising. It also explains why tech stocks surged during the dot com bubble in late 1990s.
Related » Why You Should Know Market Sentiment
Therefore, as a trader, it is always important to understand emotions among market participants in order to know the market cycle.
A good tool to use is the fear and greed index, which was developed by CNN. The index looks at the market mood by considering several factors like volatility and safe-haven demand.

Phases of a stock market cycle
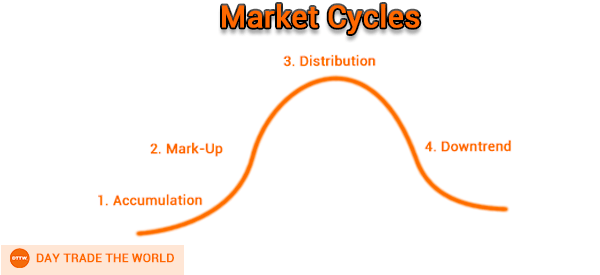
A stock market goes through four important phases, which we looked at in our article on the Dow Theory. Having a good understanding of these cycles will help you become a good and successful trader.

1) Accumulation phase
The first stage is known as accumulation. It refers to a situation where large investors are starting to accumulate stocks. In most cases, they believe that equities have become extremely cheap and that the bullish trend will start.
Accumulation usually starts in a period when the market is a bit bearish. As such, accumulators are usually contrarians.
Related » Contrarian trading strategy
2) Mark-up phase
Second, there is a stage known as the mark-up phase. This is a period where many people start seeing stocks rise. They are then attracted to these equities and then start buying assets.
As they do that, stocks rise and keep rising as demand rises. This is also the price when the concept of fear of missing out (FOMO) emerges since traders are always buying the dip.
3) Distribution phase
The third stage of a stock market cycle is known as the distribution phase. This is a situation where the bullish trend ends and many experienced traders start selling their holdings.
Besides, they have made a fortune as the market kept rising.
4) Downtrend phase
Finally, there is the downtrend phase. This is a period where stocks begin a new bearish trend as investors start exiting their previous positions.
This phase can be extremely tough for the market since most people are usually selling their holdings.
How long do market cycles last?
A common question among traders is how long market cycles last. As we experienced between 2010 and 2020, a market cycle can last for more than a decade.
In this period, major indices like the Dow Jones and the S&P 500 kept rising as earnings growth continued.
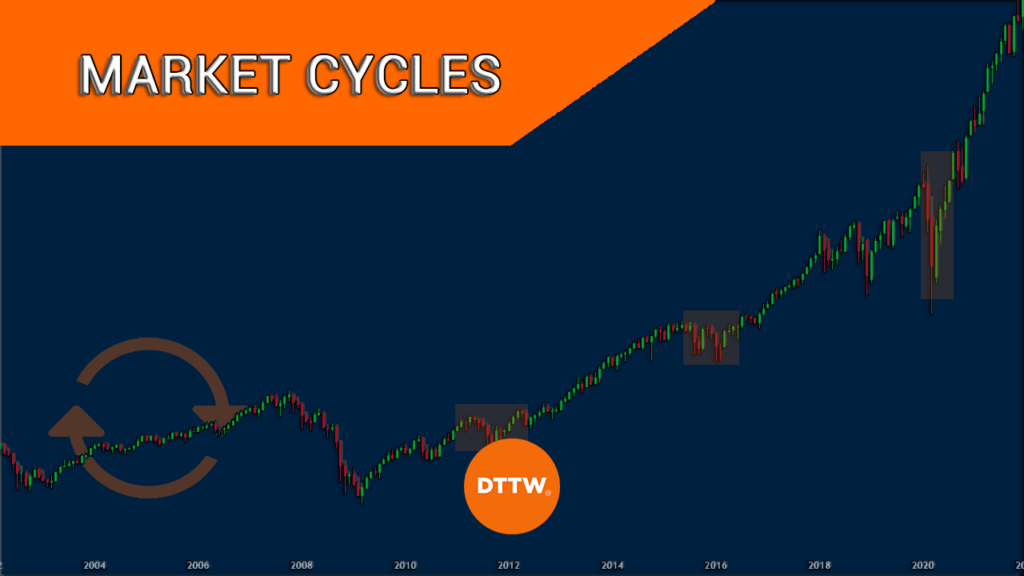
However, as you will realize, a market cycle is usually not a straight line. A bullish market cycle tends to have some small cycles inside it.
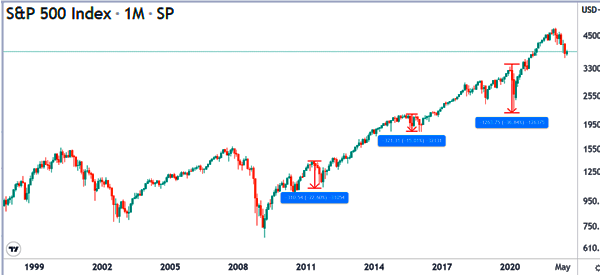
For example, as you can see below, the S&P 500 index went through a major bull run starting in 2009. But during this time, the index dropped by more than 15% several times.

Market cycle timing strategies
A common challenge among investors and traders is on how to time the market. Fortunately, there are several trading strategies to use when timing the market cycle.
First, as mentioned above, you can use the fear and greed index. This is an important index that uses a set of smaller indices to determine a market cycle.
Second, you can use technical analysis to determine the stage of the market cycle. For example, one of the best technical indicator to help you with a market cycle is moving average.
In a bull run, stocks and their indices will typically be above their moving averages. You can also use other popular indicators like Ichimoku and Bollinger Bands.
Third, price action is an important concept when timing a market cycle. This is a process where you use chart analysis strategies to determine whether a new cycle is starting.
For example, if the S&P 500 index forms a head and shoulders pattern, it can be a sign that a new bearish market cycle is about to form.
Summary
In this article, we have looked at what a stock market cycle is and how to identify it. We have also identified some important strategies to use when trading in different market cycles.
A common strategy is known as trend-following. It involves buying and holding in a bullish cycle and shorting during a bearish cycle.
External useful resources
- Stock price cycles and business cycles – ECB [PDF]


