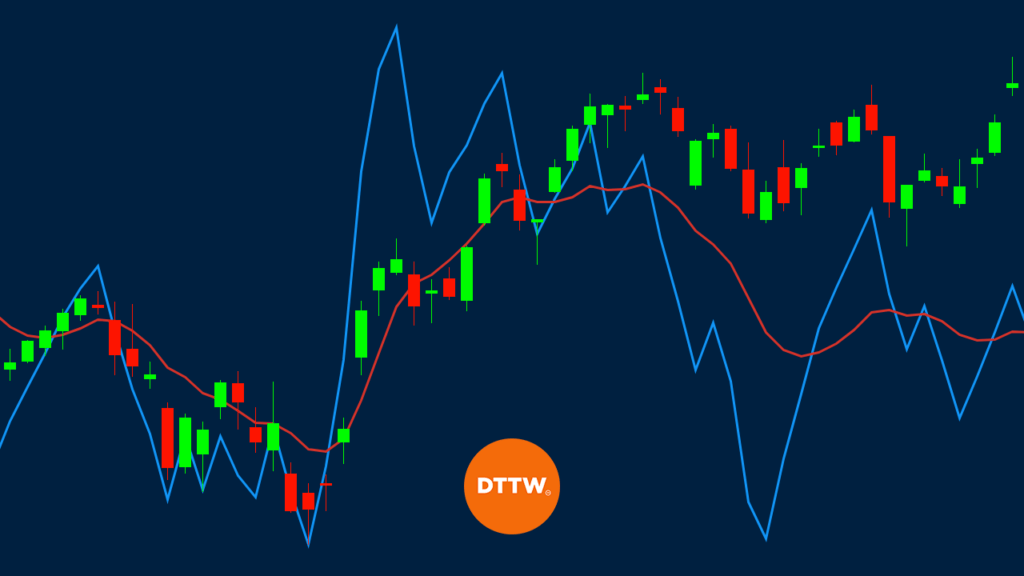
There are thousands of technical indicators in the market (here we listed just some of them). These indicators are useful because they help traders forecast the movement of a financial asset like currencies, stocks, and commodities.
These indicators can be relatively simple to calculate. For example, the simple moving average is calculated by just adding the closing prices and dividing it with the periods. Other indicators are usually calculated using complex mathematical formulas.
In this report, we will look at the Klinger Volume Oscillator (KVO). This is an indicator that is not very popular and one that is relatively difficult to calculate (but it doesn’t mean it’s not useful).
Table of Contents
What is the Klinger Volume Oscillator?
The Klinger Volume Oscillator was created by Stephen Klinger (introduced for the first time in a ‘Stock and Commodities Magazine‘ article, in December 1997). As the name suggests, the indicator combines the concept of volume and that of oscillators, and it was developed to be both short-term sensitive and long-term accurate.
As we have written before, volume is very essential in trading because it helps show the seriousness of the movement of a financial asset. For example, a sharp increase in price of a currency that is not supported by large volume can turn out to be a false breakout.
When applied in a chart, the KVO indicator is usually seen as two lines and a centreline.
Formula: How the KVO is Calculated
The Klinger Volume Oscillator is calculated using a relatively long and complex mathematical calculation. Therefore, as a trader, it is not mandatory that you know how to do this computation. Instead, you should learn how to interpret the indicator in a chart.
The first step of calculating the KVO is to find the VO. You get this by subtracting the 34-period EMA of VF from the 55 period EMA of VF. The VF is the volume force. This VF is calculated using the following formula:
| VF = V x [2 x ((dm/cm) – 1)] x T x 100 |
In this, the V is the volume while T is the trend.
Trend is calculated using the following formula:
| Trend = +1 if (H +L+C) > (H-1 + L-1 + Cv-1) |
In this, H is the high, L is the Low, and C is the closing price.
How to Trade with the Klinger Oscillator
Read the KVO
As mentioned above, the Klinger Volume Oscillator is made up of two lines and the centrelines. At default, the two lines are usually red and blue in colour. The blue line is the signal while the red line is the Klinger.
As with most indicators with two lines, the key points to watch are when a crossover happens between the two lines. Another level to watch is when the two lines pass the centreline.
Buy & Sell signal
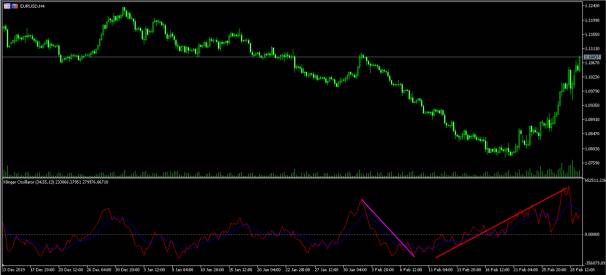
A buy signal is usually formed when there is a crossover between the two lines when it is below the centreline. A sell signal, on the other hand, is formed when there is a crossover between the two lines when they are above the centreline.
A good example of this is shown on the chart below. Notice the red and pink lines.
Combining KVO with other indicators
As you can see above, there are times when the crossovers don’t precede a direct movement of the price. Therefore, it is usually recommended to combine the indicator with other popular indicators. This strategy applies to other technical indicators as well.
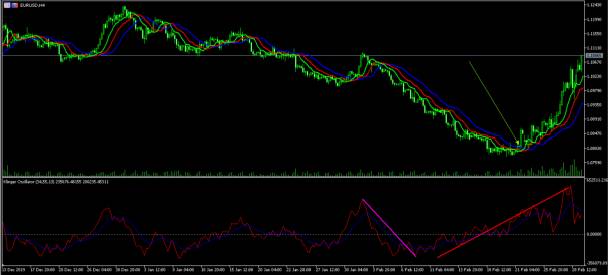
A good indicator to combine it with is the alligator. A good example of this at work is shown below.
Other popular technical indicators that you can use in combination with the Klinger Volume Oscillator are trend indicators like Bollinger Bands, Relative Strength Index (RSI), and MACD.
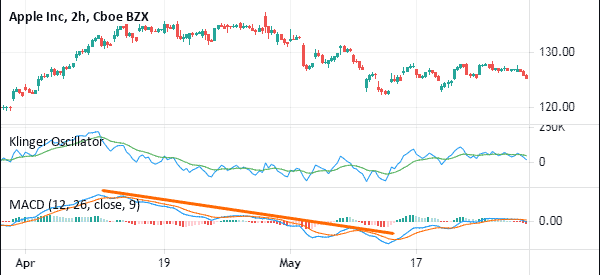
The chart below shows the Klinger indicator used together with the MACD. As you can see, the two usually moves in a similar direction.
In addition to these indicators, it is required that you use several charting tools when using the KVI indicator. Some of these tools are the Fibonacci retracement and Andrews Pitchfork. Also, you should use other chart patterns like triangles, head and shoulders and pennants in your predictions.
Trading divergences with KVO
The next trading strategy to use with the Klinger oscillator is to find divergences. A divergency situation happens when the price of an asset is rising while the indicator is moving in the opposite direction, and vice versa. A divergence usually leads to a change of direction of the financial asset. An example of this is shown in the Apple chart shown below.
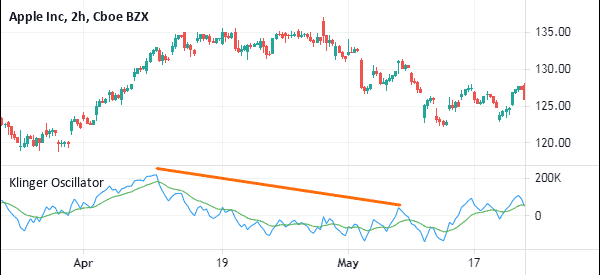
The only challenge with using divergence in trading is that the pattern takes so long to form. As such, it is not a popular strategy to trade.
Key Take-Away
The Klinger indicator is not a popular among traders. You should give it a try when you are creating your trading strategy and see whether you will love it.
If you won’t love it, you can try using other indicators that we have covered before like the Relative Strength Index and Bollinger Bands.
External Useful Resources
- Klinger Oscillator Definition – Investopedia
- Sample strategies about Klinger – Tradingview


