

Reversals are an important part of trading and investing since they signal the end of an existing trend and the start of a new one. A trader who is able to methodically spot a reversal is able to achieve the most success in the market.
There are several approaches for spotting a reversal in assets like stocks, currencies, crypto, and bonds. You can use indicators like moving average, Relative Strength Index (RSI), and the MACD.
Alternatively, you can use reversal chart patterns like the head & shoulders, double top and double bottom, rising and falling wedge, and a rounded bottom. Further, you can use candlestick patterns like hammer, doji, and morning star.
This article will look at the kicker pattern, which is another reversal candlestick pattern you can use when both day trading or investing.
Table of Contents
What is the kicker pattern?
The kicker pattern is a candlestick pattern that is used by day traders and investors to spot a reversal. There are two types of kicker patterns: bullish and bearish. A bullish kicker happens during a downtrend and is usually a sign that an asset will start a new uptrend.
Similarly, the bearish kicker happens in an uptrend, sending a signal that the asset will start a new bearish trend. In both, these kicker patterns are characterized by a gap that happens between candlesticks.
How is a bullish kicker pattern formed?
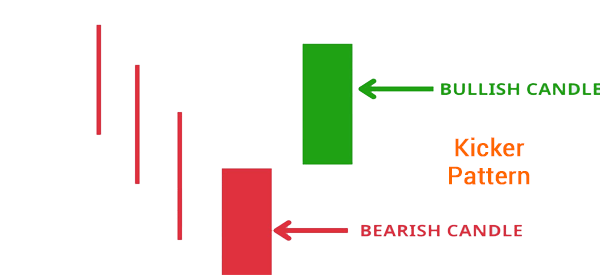
A bullish kicker pattern happens during a downtrend. It happens when a long bearish candle (often the red one) is followed by a long bullish candle that is separated by a gap. In a daily chart, this means that a stock closed sharply lower today followed by an up gap with a long bullish candlestick.
A gap forms when an important event happens in the market. For example, if a stock closes at $10 on Monday, it can open at $12 the following day for several reasons. Some of the most notable causes of gaps are:
- corporate earnings
- a merger and acquisition (M&A)
- an FDA approval of a drug
- company-specific news
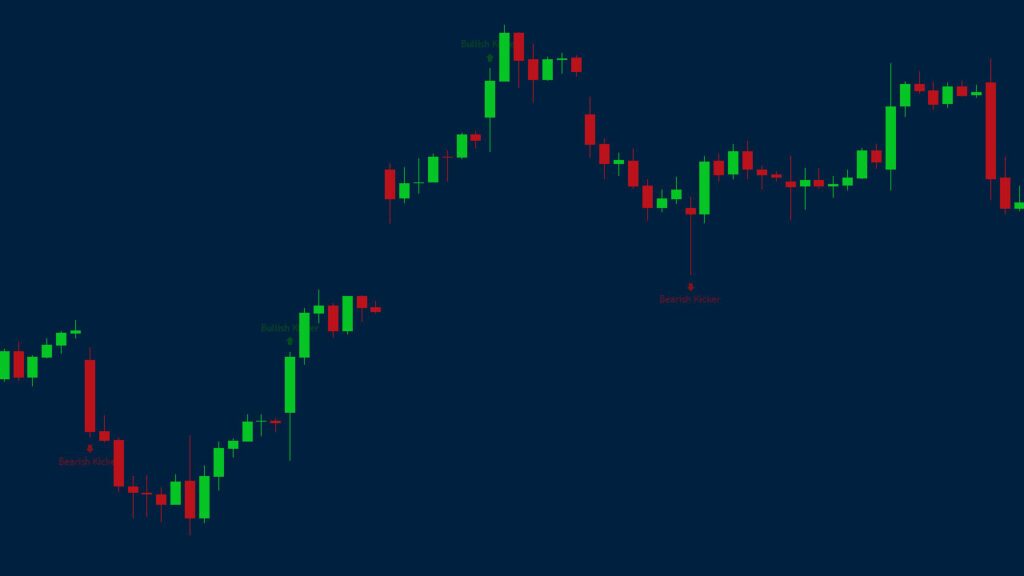
The chart below shows how the bullish kicker pattern forms. As shown, the asset was in a downtrend and formed a long bearish candle. On the following day, it opened above the previous day high and formed a long bullish candle.
This pattern implies that there is a change in momentum in an asset and that bulls are starting to come in. As such, it sends a signal that the uptrend will continue for a while.
How a bearish kicker pattern forms
A bearish kicker pattern forms in the exact opposite of the bullish kicker one. It happens when an asset is in an uptrend and then it forms a bearish reversal followed by a long bearish candlestick.
The down gap can be caused by a company publishing weak financial results, a denial of an FDA approval, and other negative things. When it forms, the pattern is usually a sign that a financial asset will start a new bearish pattern.
What does the kicker pattern mean?
The kicker pattern means that a financial asset moving in a certain trend is about to turn around and move in the opposite direction.
In the case of a bearish kicker, it means that an uptrend is losing momentum. This is firstly indicated by the down gap and then confirmed by the size of the next bearish candlestick. When it happens, it is a sign that the asset’s downtrend will continue.
Similarly, when a bullish kicker forms, it is a sign that the downtrend is fading and that a new uptrend will form.
How to identify bullish and bearish kicker patterns
A common question among many traders is on how to identify a bullish and bearish kicker pattern. There are two main ways of doing this. First, the easiest approach is to use TradingView’s indicator search.
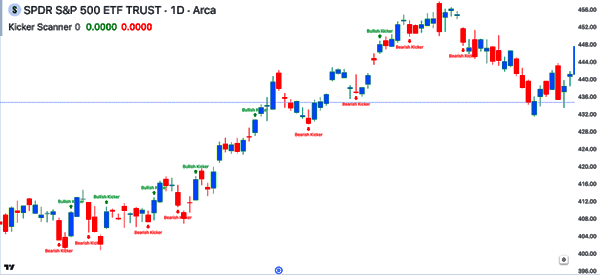
TradingView has an indicator known as Kicker Scanner, which scans a chart and identifies bullish and bearish scanners. The chart below shows the kicker candlestick patterns it has identified in the SPY ETF. While this indicator is a good one, you should always take its signals with a grain of salt.
The other approach of identifying the kicker pattern is to visually scan an asset. You can do this as part of your multi-timeframe chart analysis.
This is an approach where you look at at least three chart timeframes before you make a trading decision. You can look at the daily chart followed by the four-hour and the 30-minute chart.
How to use the kicker pattern
There are several steps that we recommend when using the kicker pattern. First, you should check out the main catalyst for the asset since it involves a gap. Always know the main cause of that gap! For example, if a stock made a down gap after publishing a strong earnings report, there is a likelihood that it will be filled.
Also, if a stock forms a down gap because of a major issue in another company, there is a likelihood that the gap will be filled.
Second, always do a multi-timeframe analysis. We recommend looking at three time frames. The benefit of doing that is that it will help you to identify the key support and resistance levels. It will also help you to identify false signals.
Third, wait for the confirmation. Instead of placing a reversal trade instantly, it makes sense to wait for a few hours or days to confirm the reversal.
How reliable is the kicker pattern?
As with all candlestick patterns, the kicker pattern is not always reliable and there are times it will give you a false signal. In line with this, traders and investors use several approaches to improve the reliability of the pattern.
For example, they combine it with other chart patterns like head and shoulders and double-top and bottoms. In addition, they confirm the validity of the pattern by using technical indicators like moving averages and Bollinger Bands.
The other important way to use the kicker pattern is to look at volume. Therefore, on its own, the kicker pattern might give a false signal, which means you should always confirm the reversal.
Kicker pattern strategies
Using the kicker pattern with chart patterns
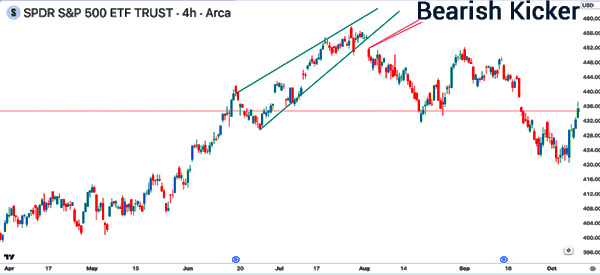
One of the best approaches for using the kicker pattern is to combine it with other chart patterns. For example, you can use it with the rising wedge pattern as shown below.
The chart shows that the SPY ETF is in an uptrend and has formed this wedge. As it nears its end, it forms a down gap followed by a big down candle, leading to more downside.
You can use the kicker pattern with other patterns like double and triple top and bottom.
Using kicker with double-moving averages
The other kicker trading strategy is to use a faster and shorter moving average. The most popular of these approaches is the death and golden cross. These crosses form when the 200-day and 50-day moving averages. However, most day traders use much shorter moving averages.
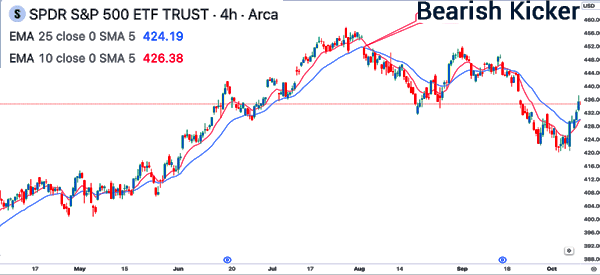
In the chart below, we see that a bearish kicker pattern formed. Now, instead of placing a bearish trade at this level, you can wait for the 25-period and 10-period moving averages to crossover.
Using pending orders
The other approach is to use pending orders when placing trades. A pending order is where a trader directs a broker to open a trade when an asset reaches a certain price. It can help to protect you from being caught in a false breakout.
For example, in a bearish kicker candlestick, you can place a sell-stop a few points below the lower candle. In a bullish candle, you can place a buy-stop above the green candle.
Kicker candle vs exhaustion gap
In this article, we have looked at what the kicker candle is and how to use it in day trading. A common question is on the difference between the kicker candle and the exhaustion gap.
An exhaustion gap is formed, mostly on the daily or weekly chart, when an asset is moving in an uptrend or downtrend then forms a gap in the opposite direction. This gap is characterized by rising volume. The difference between the two is that in a kicker, the gap is followed by a longer candlestick.
FAQs
What is the success rate of the kicker candlestick?
The exact success rate of a kicker candlestick pattern has not been identified. Like other patterns, this rate will depend on your trading strategy and the overall market conditions.
What are the key aspects of a kicker candlestick pattern?
There are four main aspects to remember when using the kicker candlestick pattern. These are the trend, volume, support and resistance, and the news. Always look at these aspects before you open a trade using the kicker pattern.
How often do the bullish and bearish kicker patterns?
Unlike other chart and candlestick patterns, the bullish and bearish candles are not popular. They form only on relatively rare occasions. In a daily chart, the pattern can form only a few days per year.
External useful resources
- The Kicker Candlestick Pattern vs. Exhaustion Gap – Tradingsim

