Price action is an important and common trading strategy that traders use to identify entry and exit positions. There are several approaches to the price action strategy. One of them is to use the cup and handle pattern.
This is a bullish pattern that was developed by William O’Neill, who wrote about it in a book he published in 1988.
The cup and handle pattern is part of the so-called continuation patterns. Other such patterns are the ascending and descending triangle pattern and bullish and bearish flags and pennants.
Table of Contents
What is the cup and handle pattern?
The cup and handle pattern is a pattern that traders use to identify whether the price of an asset will continue moving upwards. As the name suggests, the pattern is made up of two sections; a cup and handle. The cup pattern happens first and then a handle happens next.
The pattern happens when bulls are overpowered by bears in. As more bears come, the price moves lower to a certain point. Bulls then start coming in and take the price to the previous high. Bears come in again and push the price lower. Finally, bulls come in and push the price higher.
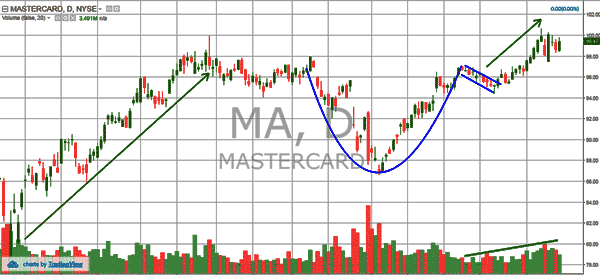
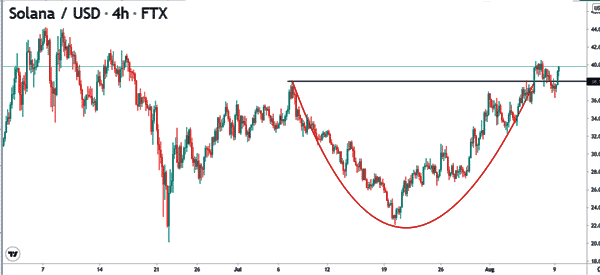
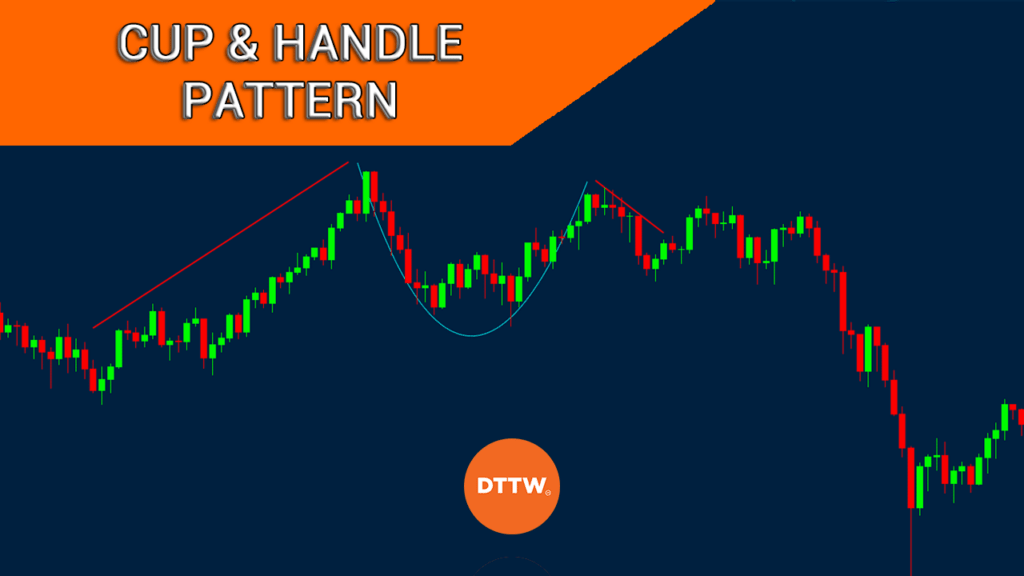
The cup and handle pattern is called so because of its appearance. When looked at closely, it looks like a cup with a handle. The handle can be a small consolidation or slight pullback. The chart below shows how a cup and handle pattern look like.

What does the cup and handle tells you?
The cup and handle tells you that the price will continue with its bullish trend. It also tells you where to expect the initial resistance level. This resistance happens at the level where the price reached and started falling.
Further, the pattern tells you not to worry when the price reaches at the resistance and either consolidates or starts retreating. This is part of the formation of the handle pattern.
Third, it shows you the potential level to watch out when the price experiences a bullish breakout. Most brokers measure the length between the highest point of the resistance and the lowest level of the cup. They then apply the same length to add their price target.
Finally, it tells you that the price could retest the resistance level after breaking out. This is known as a break and retest strategy.

How to Identify the Cup and Handle
Previous Trend
Therefore, there are a few things that need to happen for the cup and handle pattern to take place. First, the pattern happens only when there was a previous trend before. In this case, the asset needs to be moving in an upward trend.
The Bottom and the Depth
Second, the cup section should look like a U even from a distance. This means that the bottom should be a bit rounded and not like a V. This is because the latter is usually considered a very sharp reversal.
Second, the depth of the cup is also very essential. In most cases, you should ensure that the depth is about a third of the previous upward trend. A good way to note this is to use the Fibonacci Retracement.
The Handle
Also, the right side of the cup should always come nearer to the previous high point. Finally, the handle should move lower to about half of the top of the handle.
Cup and Handle + fib retracement
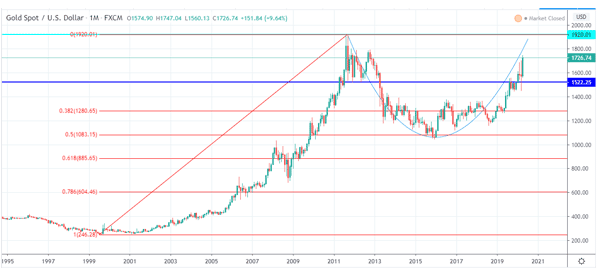
A good example of cup and handle pattern at work is to look at the long-term chart of gold.
As you can see below, the price of gold has been on a bullish trend for years. The price reached an all-time high of $1920 on September 2011.
The price then started to decline and reached a low of $1050 in October 2015. The price has been on a slow upward trend since then.
Also, you can see that the lower part of the up happened when the price reached a 50% Fibonacci Retracement level.

Therefore, we believe that the upward trend will continue as bulls attempt to retest the previous high of $1920. When it does this, we expect that there will be an indecision between the bulls and the bears, which will push the price lower before an eventual rally.
What about an inverted cup and handle pattern?
An inverse cup and handle pattern is the exact opposite of what we have talked about. The pattern happens when the price of an asset is declining.
It then finds some support and moves upwards again and finds resistance around the 50% retracement. It then moves downwards and forms an inverse of a cup, rises slightly and then continues falling.
How to trade the cup and handle
Trading the cup and handle pattern is a relatively easy process. Since it is a continuation pattern, you should remain bullish since the price will likely maintain the bullish trend after rising above the resistance level.
The next way to trade the pattern is to wait for a break and retest. Here, you should wait for the price to retest the now-support level and place a bullish trade.
Finally, you can use a buy-stop trade to take advantage of a bullish trend. This is a situation where you place a buy-stop order above the resistance. In this case, a bullish trade will be opened after the price rises above the resistance level.
How reliable is this pattern?
There are several benefits of using the cup and handle pattern. First, it is a relatively easy pattern to identify in a chart. Second, you don’t need to use any technical indicators like the RSI and moving averages. Third, the pattern is usually accurate most of the time.
Disadvantages
The main disadvantage is that the pattern tends to take a long time to form. For example, the pattern on the gold chart above has been happening since 2011. Still, you can also identify it in shorter-dated charts.
Summary
The cup and handle pattern is a common method you can use to analyse the trend of assets. You can use it to analyse stocks, currencies, bonds, commodities, and index funds among others.
We recommend that you combine it with other tools like Fibonacci and indicators like moving averages.
External useful Resources
- Cup with Handle in Charts – StockCharts
- Profitable Cup and Handle Trading Strategy – TradingStrategyGuide


