

Oscillators are some of the most important indicators in the financial market. These oscillators are important because of their importance in identifying when markets are overbought and oversold. They are also useful when confirming a trend.
Because of how important they are, they are used by Wall Street on a daily basis. Some of the most common oscillators are the relative strength index (RSI), MACD, and the relative vigor index (RVI).
In this article, we will look at the commodity channel index and how you can use it in the financial market.
Table of Contents
What is the CCI indicator?
The Commodity Channel Index (CCI) is a popular oscillator that was created by Donald Lambert. As the name suggests, his goal was to create an indicator to identify extremes in the commodity market. Over the years, the CCI indicator moves from his original purpose and today it can be used to trade all types of financial assets like crypto and stocks.
The CCI indicator measures the price of an asset relative to an average level over a certain period. In most cases, the default period is usually 20 days although one can change it to meet their trading strategy. By measuring these prices, the indicator helps to gauge whether the price is high or low relative to that historical level.
The CCI indicator has a close resemblance to other oscillators like the Relative Strength Index (RSI) and the Stochastic.
CCI Formula: How to calculate the Commodity Channel Index
As with all technical indicators, it is not always necessary to know how the CCI indicator is calculated. Most traders who use it don’t have any idea about how it is derived.
If you want to know, the following formular is used to get the CCI.
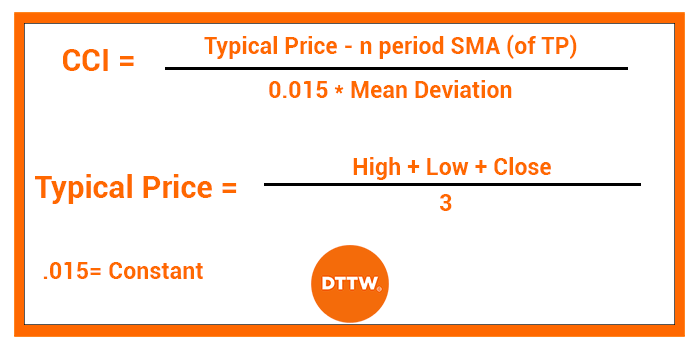
| CCI = (Typical price – 20-day SMA of TP) / (0.015 x Mean Deviation) |
The TP is known as the Typical Price and is calculated by adding the high, low, and close and dividing the result by 3.
The 0.015 is known as the constant. The Standard deviation is calculated by first subtracting the most recent 20-day average of the TP from each period’s TP.
Second, you should take the absolute values of these numbers and then add these absolute values. Finally, divide this figure by the total number of periods.
As you can see, the price calculation can be very difficult for most people.
CCI vs Stochastic oscillator
As mentioned, the CCI is an indicator that is used to identify extremes by measuring the current price level relative to an average price level of a certain period. The stochastic oscillator, on the other hand, is an indicator that shows the speed and momentum of a price movement. It follows the speed or the momentum of price.
The other difference is that the stochastic oscillator is that it has two lines known as %K and %D. The %K is calculated using this formula: (Current close – lowest low) / (highest high – lowest low) X 100. On the other hand, the %D is calculated by doing a 3-day SMA of %K.
The similarity between the CCI and the Stochastic Oscillator is that they can be used to find overbought and oversold levels. It can also be used in trend following and other strategies.
How to Use CCI when Trading
As mentioned before, the CCI measures the difference between the current price of an asset and its average change. A number that is high shows that price is above its average and a number that is low means that the price is below its average.
Therefore, the CCI can be used to identify an overbought or an oversold level. In most trading platforms like the MT4 the default period that is used is 14 (in our Ppro8 you will found 20, but of course you can change it).
Also, the CCI has three lines. These are -100, 100, and 0.
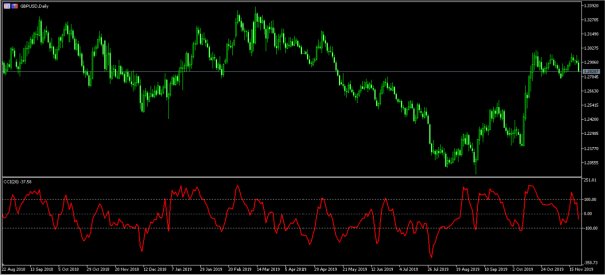
As you can see above, the price tends to recover when the CCI reaches below -100. It tends to fall when it reaches +100.
However, in between, you can see a lot of false signals. This is an indication that you should never use the CCI alone. It is always recommended that you combine it with other oscillators, volumes, and trend indicators. Doing this will help reduce the likelihood of a false signal.
Identifying overbought and oversold levels
The easiest way to use the CCI indicator is to identify overbought and oversold levels. An overbought level is an extreme period where an asset has simply gone so far high. Similarly, an oversold level is when an asset has moved sharply lower. In most cases, these levels are usually good signs that a reversal is about to happen.
In other periods, a move above the overbought level or below an oversold level can be seen as a form of an asset’s momentum.
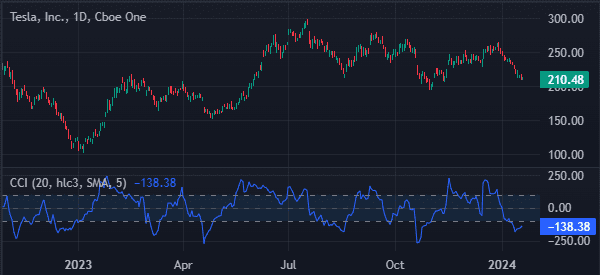
As a result, some traders buy when the asset is at an overbought level and short when it is at an oversold level. In the case of CCI, the oversold level is minus 100 while the overbought level is plus 100.
However, as with other oscillators, the CCI indicator tends to send the wrong signals, as shown in the chart below.
Using CCI to find divergences
A divergence happens when the price of an asset is going in the opposite direction as the indicator. For example, a stock may be rising while the oscillator is falling. When this happens, it is usually a signal that a reversal is about to happen.
A good example of this is in the chart below. As you can see, the overall trend of the USD/SEK pair is upwards while the CCI is declining. Therefore, this is a sign that the upward rally is fading and that the price will break-out lower in due time.
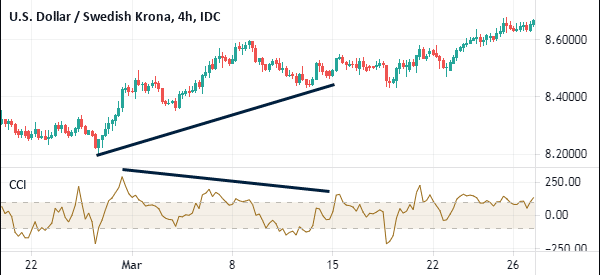
While divergences are useful, the challenge is that they usually take a lot of time to form and develop.
As shown in the chart above, it has taken more than two weeks for this divergence pattern to emerge. To solve this challenge, we recommend that you combine the CCI with other oscillators like the Relative Strength Index (RSI) and the MACD.
Role of the zero line in CCI
Like most oscillators, the CCI indicator ranges from minus 100 to positive 100. It also has a zero line, which is very important to traders. The CCI’s zero line has several roles for traders and investors.
- It indicates the neutral line. When the indicator is in this line, it sends a signal that the asset lacks direction. In most cases, it is a sign that the asset is in a consolidation phase.
- Confirm a trend – When used in trend-following, the neutral line is used to confirm the trend. For example, if an asset is rising, more upside can be confirmed if the CCI indicator moves above the neutral line.
- Divergence detection – The other use of the CCI indicator is to detect divergences. A divergence, as stated above, happens when an asset price is moving in the opposite direction with the oscillator.
- Visual centerline – As mentioned, the CCI indicator oscillates between minus 100 and positive 100. Therefore, having a zero line is important because it shows you when the asset has moved to the neutral point.
Best settings for the CCI indicator
When using the CCI indicator, you only need to adjust the length or its duration. By default, most trading platforms provide 20 as the length of the indicator. However, it is recommended that you take time in a demo account testing various periods.
For example, if you are a day trader, you can try to use a shorter CCI like 10 or 8. Similarly, if you are a long-term trader, you can use a longer duration.
CCI vs RSI
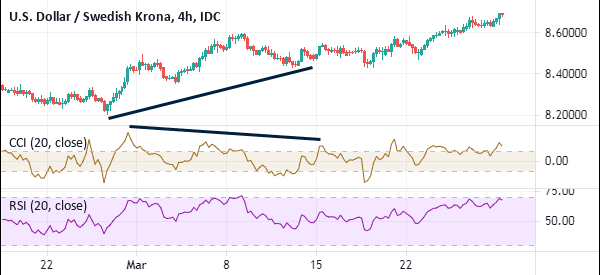
CCI and RSI are both oscillators that can help you identify overbought and oversold levels and divergencies. The latter, however, is the most popular one. RSI simply measures the speed and change of price movements in the market.
Like the CCI, it ranges between zero and 100, with moves above 70 being the overbought and those below 30 being oversold. The chart below shows a 20-day CCI and a 20-day RSI in a chart.
Pros and cons of the CCI indicator
Pros
- It is highly versatile and can be used to trade all types of assets like stocks and commodities.
- It can be used to find overbought and oversold levels.
- The indicator can be used to find divergences.
- It is highly flexible.
Cons
- It tends to send false signals in the market.
- It is a lagging indicator that uses historical data, which are not good indicators of future movement.
- It does not work well in ranging or highly volatile markets.
Final thoughts
The Commodity Channel Index (CCI) is a popular oscillator in the market. You can use to trade all assets, including stocks, currencies, and exchange-traded bonds. To use it well, we recommend that you spend a substantial amount of time in a demo account and testing different scenarios.
External Useful Resources
- How the Pro’s Trade Using the CCI Trading System – Trading Strategy Guides
- Definition of Commodity Channel Index in Wikipedia

