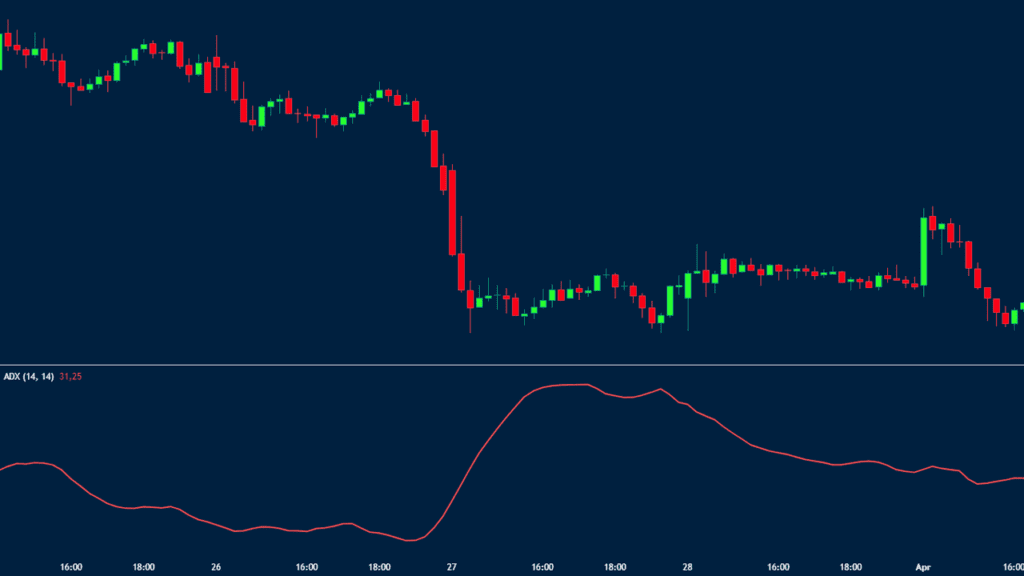
Technical analysis is one of the two most-common strategies that Wall Street traders use to forecast the direction of an asset. The process is so useful that it is now used to create expert advisors or algorithms that are responsible for a substantial part of the global market.
The Average Directional Index (ADX) is one of the most popular technical indicators used in the market today to understand if a chart is trending or ranging. In this article, we will look at the best strategy for using the average directional index.
Table of Contents
What is the Average Directional Movement Index?
The Average directional movement index is an indicator that traders use to identify the strength of a trend. The indicator is categorized in the trending category of indicators.
The ADX indicator is made up of three key parts. There is the main ADX line and the positive directional indicator (+DI) and the minus directional indicator (+DI). The latter two form the basis for the ADX.
It was developed by Welles Wilder, the famous trader who also developed other indicators like the Average True Range (ATR), Parabolic SAR, and the Relative Strength Index (RSI). He created the indicator with commodities in mind but traders can use it well across other assets like commodities, currencies, and stocks.
Like many indicators, the ADX is best-used in combination with other indicators. To make the most of its potential, the advice is to use the tool when the market is trending in either direction.
The chart below shows the Average Directional Indicator applied on the EUR/USD chart.
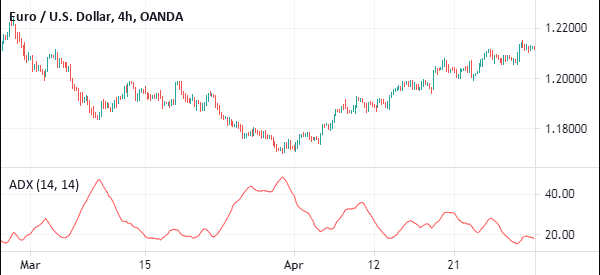
As you can see, TradingView shows just the ADX line since it is the most important in analysis. Other charting platforms like the MT4 show the ADX line and the positive and negative lines.
ADX formula
In our series of technical analysis, we have said that the development of all indicators starts from the use of mathematical calculations. As a trader, understanding these calculations is important, but not necessary.
The ADX indicator is made up of two main parts (in addition to the ADX line); the positive directional movement and the negative directional movement.
The positive directional movement (DM) happens when the current high minus the previous high is greater than the previous low minus the current low. As such, this plus DM equals the current high minus the previous high.
The negative DM happens when the previous low minus the current low is bigger than the present high minus the previous high.
How to Calculate
The process of getting the ADX starts by calculating the true range (TR), +DM, and -DM. The next step is to smooth the periodic values gotten above. This is done by dividing the 14-day smoothed DM by the 14-day smoothed true range.
To find the plus DM, you need to first divide the 14-day smoothed +DM by 14-day smoothed true range. You should then multiply the result by 100. This will help you move the decimal points.
Similarly, to find the minus DM, you should divide the 14-day smoothed minus DM by the 14-day smoothed true range and then multiply the result by 100. The DMI is calculated by subtracting minus DM from plus DM and then dividing the result by the sum of the two.
The first ADX is usually the 14-day average of DX. The next ADX values are calculated by multiplying the previous 14-day ADX by 13. The 14 number is usually the default but you can change it depending on your trading strategy.
As you can see, the process of calculating the ADX indicator is a relatively difficult process. However, as a day trader, you should not focus on calculating the indicator since it is offered for free!
How to Use ADX Indicator
Fortunately, compared to the calculation, the process of using the ADX is relatively easy. All you need to do is to visually check the chart and see whether it is trending or ranging. You should not use the ADX when a chart is ranging or consolidating.
Next, you need to check the period that is applied on the ADX. You can tweak it depending on your trading strategy.
Finally, you should apply the ADX indicator. You will see that the ADX indicator is made up of three lines: the ADX, +DI and -DI.
Trend Confirmation
The first and simplest approach for using the ADX indicator is to confirm bullish and bearish trends. As mentioned below, a trending asset usually has an ADX of above 25.
The higher the ADX index rises, the stronger the trend. Similarly, a downtrend is confirmed when the ADX is rising. A low value of the ADX could be a sign of accumulation or distribution.
How to quantify the strength of the trend
A common question is how to quantify the strength of the ADX signal. There are numerous approaches to this. The most basic approach is to use the basic template of the indicator.
In this case, an ADX figure between 0 and 25 implies that the asset has no or has a weak trend. In this case, it is often seen as if investors are accumulating the asset ahead of an eventual buying opportunity.
| ADX Value | Trend Strength |
|---|---|
| 0-25 | Absent/Weak Trend |
| 25-50 | Strong Trend |
| 50-75 | Very Strong Trend |
| 75-100 | Extremely Strong Trend |
A good example of this is shown below. As you see, the stock moved sideways during the Wyckoff accumulation period. It then staged a strong bullish breakout as the ADX index continued rising.
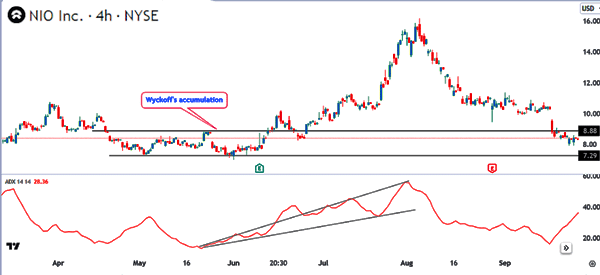
A strong trend happens when it moves between 25 and 50 while a very strong trend happens between 50 and 75. Finally, an extremely strong trend emerges when it moves between 75 and 100.
Average Directional Index Trading Strategies
To interpret the ADX, you should focus on the ADX line. According to Wilder, a strong trend is indicated when the ADX level is above 25. A lack of trend happens when the ADX is below 20.
You can see a good example of this on the GBP/USD pair below.
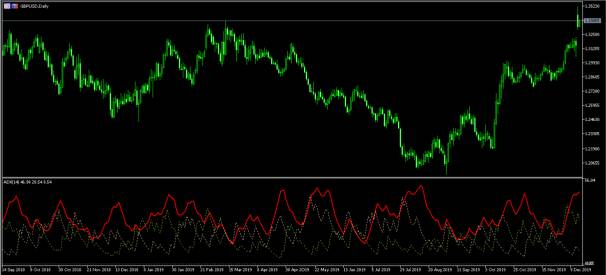
As we have written before, no indicator is 100% perfect. Therefore, it is important that you use it in combination with other indicators. Ideally, you should use it in combination with other trends, oscillators, and volume indicators.
While this is the most common method of using the ADX, in most times, it will show you the wrong signal. This is precisely the reason why you should use it with other indicators like the Relative Strength Index (RSI) and the MACD.
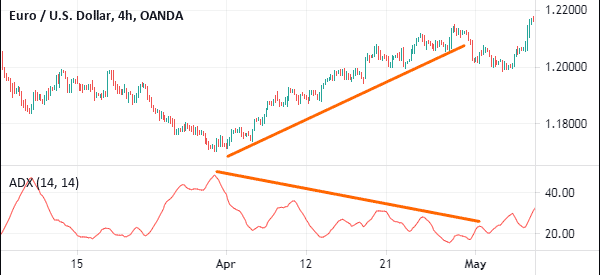
For example, in the chart below, we see that the ADX is in a downward trend while the ADX is falling. Therefore, traders who used the indicator by itself got the wrong signal.
Combining ADX with moving averages
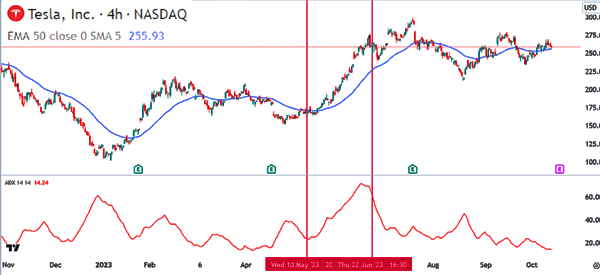
The other approach for trading using the ADX indicator is to combine it with other indicators, including the moving average. Moving averages are some of the most popular indicators that are used in trend-following. In most cases, an ascending asset remains above the moving average when it is in an uptrend.
Therefore, as shown below, Tesla shares remained in a bullish trend as it was above the 50-period moving average as the ADX continued rising. This trend ended after the ADX resumed the downward trend.
Using the ADX indicator to find reversals
The other approach is where the ADX indicator is used to find divergences. A divergence happens when a bullish trend turns bearish and vice versa. The approach of this strategy is also relatively simple.
If there is a bullish trend, the reversal happens when the ADX indicator starts changing direction. When this happens, as shown above, it sends signals that the trend is about to change direction.
Pros and cons of using the ADX indicator
There are several benefits of using the ADX indicator. The first benefit is that it is readily available in all trading platforms like MetaTrader and TradingView. Second, you can use it easily with other indicators. Third, it is a relatively easy indicator to use.
However, there are other cons of using the indicator. First, it is a relatively difficult indicator to calculate. Second, when used alone, the ADX indicator can show you the wrong signals as shown above. Finally, it can only be used in some market conditions such as when the asset is trending.
Final thoughts
The ADX is a relatively popular indicator. It is mostly used to provide the strength of a trend. While the indicator is relatively good to use, it also has some limitations as shown above. Therefore, you should ensure that you have practiced it well to succeed.
External Useful Resources
- More trading ideas and charts – Tradingview
- Full lesson about Average Directional Index (ADX) – StockCharts


