In trading, having a well-defined strategy can help you make decisions. However, occasionally, you will find that there are so many factors at play in a certain trade. This will curtail your decision-making.
For instance, assume that you are trading EUR/USD and in one day, there is economic data from Europe and the United States at the same time. In between, there are talks about various issues that have an impact in the pair.
Financial players have created a jargon for this scenario. It’s called analysis paralysis.
An easy definition? It is simply a situation where there are so many information that will hinder you from making a good decision.
What do you do when you are in such a situation? This article will highlight 4 main methods you can use to solve the dilemma.
Table of Contents
What is analysis paralysis?
A simple definition of analysis paralysis is that it is a situation where a trader conducts analysis and the struggle to make a well-defined decision on whether to buy or short an asset. It often happens when a person over thinks or over analyses an asset.
Probably due to fear of missing out on something important that could afflict the stock value.
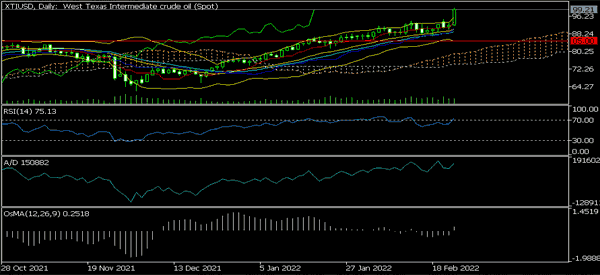
For example, instead of using a pair of technical indicators, many traders will often add more than five of them. They will then draw chart patterns and apply other theories. A good example of this is in the chart below.
As you can see, it is a bit difficult to make an informed decision when you overdo your analysis.

How analysis paralysis works
Analysis paralysis works in a relatively easy way. In most cases, it starts with a trader who identifies a certain asset that they believe will do well.
After identifying the asset, they will often start with their fundamental analysis and identify the reasons why it is trading the way it is doing. They will often read materials from multiple sources.
Next, the trader will start doing their technical analysis where they will add several technical indicators. In most cases, they will try to analyze the asset using simple indicators like Bollinger Bands and moving averages and then move to more advanced ones.
As they do all this, they will get different signals about an asset. For example, an oscillator like RSI will send a buy signal while another one will send a sell signal.
Analysis paralysis risks
There are several risks involved when it comes to analysis paralysis. Some of these risks are:
- Overtrading – At times, when you overdo your analysis, it is possible to make the mistake of opening a lot of trades in a certain period.
- Trade blindly – analysis paralysis can cause you to trade blindly. This is a situation where you trade without having a real signal.
- Revenge trading – At times, it can be a catalyst for revenge trading. This is where you lose money in a trade and then attempt to recoup your losses by opening a trade without doing much research.
How to overcome analysis paralysis
The first thing you should do to avoid analysis paralysis is to incorporate such scenarios when developing your trading system. The fact is that these situations will always be there.
As We have explained before, there is nothing new that happens in trading. What has happened today has happened in the past!
Therefore, when you are developing your trading strategy, you should ensure that you incorporate a situation where fundamental analysis and technical indicators will give you many data points. As We have explained before, you should also backtest such scenarios to see if they meet with your trading strategy.
Related » How to conduct a SWOT analysis in trading
Weight the indicators
There are times when the information provided by the technical indicators is skewed. The double exponential moving average will tell you to buy. At the same time, the Relative Strength Index (RSI) will indicate an overbought position. At the same time, the Average Directionary Index will show that a trend is forming.
Other technical indicators will then provide various data points that are not in sync with one another.
In such a situation, some traders will weight the indicators. They will take say 10 indicators and then rank each of them with the indication.
Therefore, 6 indicators will point to a buy position while 3 will show Sell while one indicator will be neutral. In many occasions this usually works. However, you should be very careful when doing this.
Take a break
We have said it before that the reason why many people lose money is that they want to do everything at the same time. This is wrong!
We have written before that some pros trade for less than one hour every day and when they make (or lose) money, They rarely look at the trading platform again. This enables every trader to have a productive day regardless of the direction his trade takes.
In times when there are so much information, We opt to take a break and keep off from trading. In a day, there will always be new opportunities that you can trade with. So, take a break and do something else.
Eventually, the news will fade and the technical indicators will produce good signals for you.
» Related: What can you do in your free time?
Turn the TV Off
Turn off Bloomberg. Turn off CNBC. While these TV channels provide the best financial news, they have an important shortcoming. They often feature financial ‘experts’. In many cases these experts provide information that is not correct.
An anecdote may be useful for this; We remember a day when We was starting to trade. It was on a Wednesday and we were expecting the inventory number from EIA. In the morning, the news anchor announced that the EIA will announced increased inventory levels. She didn’t state that the number was merely a projection.
We then went to our terminal and sold short oil. Later in the day, We lost so much money with that trade.
We advise you to switch off these TV channels and make an independent analysis devoid of the financial expert opinion.
F.A.Q.s
How trading analysis paralysis affects traders?
There are many ways in which analysis paralysis affects traders. For example, it can lead to substantial losses because you are trading without a clear view. Second, it can cause you to miss important trading moves. Also, it has emotional consequences.
Can it be a permanent paralysis?
In most cases, many people manage to move away from a stage of analysis paralysis. They do this the hard way after realizing the mistakes of opening trades without a clear picture.
Why is analysis paralysis bad?
It is bad because traders do a lot of work that is often unnecessary and then lose money. For example, there is no justification of using more than 8 technical indicators in chart analysis.
Summary
Having the right information in trading is critical to not losing money and generating profits. Having too much of it, however, can create confusion and lead to analysis paralysis.
No, this is not such a rare phenomenon. So you must always be ready to overcome this phase or, in some cases, to stop your trading activity for a few hours.
You don’t want to incur some of the risks we listed above, do you?
External useful resources
- Avoiding The Trap Of Analysis Paralysis In Trading – OneUpTrader


