Just as the earth cycles through its seasonal transformations, from the icy embrace of winter to the vibrant bloom of spring, so too does the financial landscape exhibit its own rhythmic patterns, known as seasonality in trading.
In the finance universe, however, “seasons” are not constrained by simple weather patterns, but manifest themselves as recurring trends and behaviors within markets.
These seasonalities, similar to their weather counterparts, present unique characteristics and opportunities that astute traders can exploit.
Seasonality in trading is not merely an abstract concept; it is something that has captured the attention of investors and analysts, repeatedly offering insights into the flow of market dynamics and the potential patterns that arise from them.
By understanding the cyclical nature of market behavior, traders can harness the power of seasonality to refine their strategies and enhance their trading returns.
Table of Contents
What is seasonality
First, let us clarify the broad concept. Seasonality refers to predictable and recurring patterns or fluctuations that occur over a year (or different time periods) which are often influenced by factors such as weather, holidays, or other calendar-related events.
Understanding these patterns is important for making informed decisions in fields such as economics, business, and biology, as it can help predict and adapt to these potential changes.
Market seasonality relies on the recurring patterns and trends exhibited by stocks and other assets during certain periods of the year. These patterns often take off from a conjunction of factors, including investor sentiment, institutional behavior, and external influences, such as geopolitical events and macroeconomic indicators.
One of the best-known seasonal phenomena is the “January effect,” first identified in 1942 and later popularized by Robert Haugen in 1992.
This effect highlights the tendency of stocks to perform exceptionally well on trading days that straddle late December and early January. The reasons behind this phenomenon are the reversal of year-end tax strategies and portfolio adjustments by major investors.
Another famous pattern is the “Mark Twain effect,” named after the famous writer. This observes a historical downward trend in stock prices toward the end of October.
Although seasonal patterns like these may offer valuable insights, these trends are by no means binding on actual asset performance. It is essential to analyze historical data and market dynamics to validate their reliability.
Why does seasonality happen?
Okay, as we just told you, we should not blindly follow the indications that these seasonal events provide. But ignoring their trading signals would also be wrong! That is why we need to know and understand this concept.
Predictable Patterns
Seasonality lets us identify recurring trends in stock prices, similar to how we can anticipate the timing of seasons throughout the year (at least from a calendar perspective). Recognizing these patterns can help us make reasoned hypotheses about price trends.
Take for example one industry, retail companies. In the last months of the year, thanks to Black Friday and the holiday season, you might notice that stock prices tend to rise. Well..This is a predictable seasonal pattern!
Risk Management
This benefit is a direct outcome of what we have seen above. Anyone, when the weather is bad, will pack an umbrella before going out. Avoiding the risk of getting wet is important. Regardless of whether it then rains or not. Or, in Summer, we all take the right precautions before exposing ourselves to the sun.
Here, the same thing is true for trading. Knowing in advance that some events will occur, or that they have a high chance of occurring, will allow us to take the right precautions.
Such is the case with corporate earning seasons. As much as day traders and scalpers love volatility, the one that is generated on financial data release day can easily get out of control due to overreactions (or misreactions) in the markets. So, if you are not sure what you are doing, you might avoid trading. Or at least avoid certain sectors.
Data-Driven Decision-Making
Seasonality promotes an analytical and disciplined approach to trading, encouraging traders to rely on facts and historical patterns rather than emotions. The data must then be validated, but it is still better to start with something real than to rely only on our instincts.
Let’s take a practical example. After conducting research and analysis on a given stock, we enter the trade. Instead of going up, the stock goes down. Fear of being wrong comes over us.
Our instincts would tell us to close the trade immediately, accept the loss and start again. But could it be that you are totally wrong in your analysis, despite the fact that the historical data and signals are in your favor?
It is important to rely on historical data and your trading strategy to make informed decisions. And this, as we have seen, includes proper risk management strategies.
Understanding the different seasonalities and their drivers
As we have discussed previously, seasonal market patterns often result from a complex interaction between:
- psychological factors
- fundamental factors
- historical precedents
- investor sentiments
For example, the “January effect” is attributed to year-end fiscal strategies and portfolio rebalancing by investors, while the “Santa Claus rally” is fueled by positive sentiment and capital inflows as investors position themselves for the New Year.
Another popular period, called “Sell in May and go Away” is based on the belief that during the summer months from May to September are less profitable for generating profits.
While market seasonality can provide valuable insights analyzing recurring patterns and trends, traders must pay attention and avoid overreliance on seasonal factors alone. External influences such as geopolitical events and macroeconomic trends can overshadow seasonal patterns, leading to unexpected market movements.
In addition, we must always pay attention to which market we are referring to. Seasonality in the world of stock trading is not the same as in forex or commodities. And each of these has different triggers.
From the examples above, and from the best known periods we will analyze later on, it is quickly clear that there is no single way to define seasonality. And not even a set time horizon.
We can consider several months, as in the case of “Sell in May and go away,” predefined deadlines (as in the case of quarterly earning seasons, or certain commodities) or certain days of the week.
But not only that. In addition to broader seasonal trends, intraday seasonality offers insights into how market activity fluctuates during the trading day.
Take as an example the forex market, which as we know is open 24 hours. Yet these hours are not all the same! In fact, trading volumes tend to peak during the European and American sessions and their intersections (overlaps), while during the Asian session this is fairly low.
Similarly, the stock market operates in distinct sessions (pre-market, regular session, extended session), but not all of them have the same relevance. Usually, the first and last hours are the most active, in terms of volume and liquidity, so they have a kind of ‘seasonality’.
Examples of key seasons in the market
Several seasonal events have come to the attention of traders, even without having any real correspondence in asset charts.
After mentioning a few of them throughout the article, it is time to go into some more detail and make you aware of the most well-known ones.
January Effect
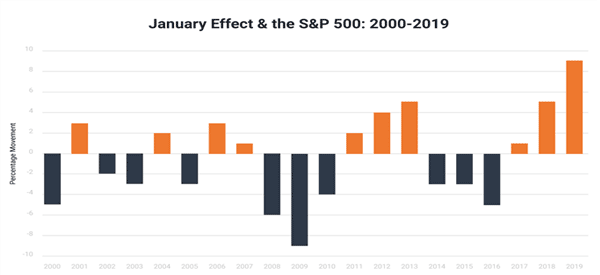
The January Effect is the idea that stocks, especially the S&P 500 index, usually rise in January. Investors believe that stocks bounce back in January after experiencing a dip in the final week of December (right after the Santa’s Rally).
The most common explanation is tax-loss harvesting – investors sell underperforming stocks in December to claim capital losses, then reinvest in January, driving prices up. While the January Effect has been observed historically, its magnitude has decreased over time. It is considered a calendar anomaly, not a reliable predictor of future returns.

Sell in may and go away
This is an important concept in seasonality. It refers to a situation where stocks tend to underperform in months after May, as investors focus on the summer period.
While the “Sell in May” effect has been statistically significant in many studies, it does not occur every year. We recommend not paying too much attention to this specific seasonal event, especially if you are a day trader or scalper.
Your interest here is in charts with very short timeframes, from one minute (if not a few seconds) to hourly. Assessing 6 months of performance is therefore completely useless.
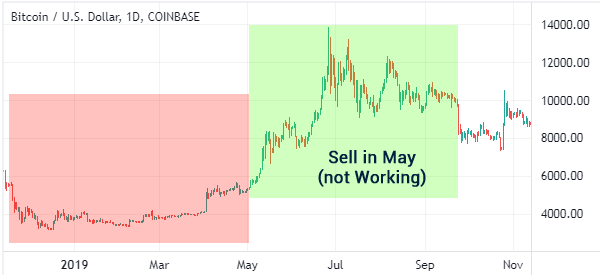
Moreover, this market imperfection often betrays expectations, as we can see in the example below in the BTC/USD chart.
As you can see, Bitcoin had a strong performance between January 2021 and May of that year.

Its price rose by about 106% in this period. But from May, it dropped from a high of $64,400 to a low of $28,589 in June. But it then made a spectacular rally in the final part of the month.
However, this concept did not work out well in 2019. We ignored 2020 because of the volatility that happened due to the Covid pandemic. As shown below, Bitcoin had a strong performance in the first part of 2019 as its price rose by over 47%. But this rally accelerated in the following months after May.

Santa’s Rally
Santa Claus rally is defined as a situation when stocks rally towards Christmas day. This rally happens mostly because of the perception that stocks and cryptocurrencies do well in this period.
The concept of the Santa’s rally started in the 1970s when some investors noticed that stocks tended to rally sharply before Christmas.
This may be one of the most interesting events to consider for several reasons. First, even short-term traders can incorporate it into their strategy, since it is a one-day trade. Then, it is one of the seasonal events that has had the greatest real-world feedback in the financial markets. As we can see in this research, which considers the years 1987 to 2018.
The right strategies and risk management
Although some seasonal patterns can offer valuable opportunities for traders, it is essential to approach them with caution and incorporate them into a solid trading strategy that can work and generate profits in any market condition, and not just those based on certain events.
Although some seasonal events-we have seen them above-have gained great attention, it is essential to critically evaluate their historical performance and understand their drivers. Traders must be wary of myths and misconceptions about seasonality and base their decisions on empirical evidence and rigorous analysis.
In addition, understanding the limitations and nuances of seasonal models is critical to avoiding common pitfalls and optimizing trading performance under all market conditions.
Rather than relying solely on seasonality, professional traders must analyze and combine it with technical and fundamental analysis to make informed decisions that are not driven by some bias or misconceptions.
In addition, risk management must remain a top priority, as seasonal trends do not always develop as expected, leading to potential losses if not managed properly.
That being said, we want to give you some practical advice for both developing your strategy and safeguarding your account.
Strategy Building
As we have mentioned many times, these seasonal events are predictable, so we can study and analyze them in advance. These, however, are not all equal to each other.
Calendar-based seasonality – This category includes all the ones we looked at in detail earlier (January effect, Sell in May, Santa’s Rally). These strategies involve trading based on specific calendar dates or events, such as holidays, months, or quarters.
Event-driven seasonality – These strategies involve trading around specific holidays or events that can influence market sentiment and trading activity.
For example, the Holiday Retail Play (Buying retail stocks ahead of major holidays such as Christmas or Black Friday) or the Back-to-School Effect (Buying consumer and retail stocks ahead of the back-to-school shopping season).
Seasonality of commodities – Traders can (it’s better to say must…always base everything on data) analyze historical patterns of commodity prices to identify recurring trends determined by factors such as weather, supply, and demand. Some examples are:
- Buying natural gas before winter, when demand increases for heating.
- Crop Cycle Investing, trading agricultural commodities based on planting and harvesting seasons.
Global Economic Seasonality – Strategies that take into account economic conditions and events that tend to recur annually, such as earnings seasons, tax deadlines, and economic reports.
Summary: Embracing Seasonality as a Strategic Advantage
In conclusion, market seasonality offers a rich plethora of insights and opportunities for traders willing to delve beneath the surface.
Whether exploiting seasonal trends for short-term gains or incorporating them into a broader trading strategy, embracing market seasonality as a strategic advantage can unlock new possibilities and elevate trading performance in today’s dynamic financial landscape.
The key is to analyze historical data to identify consistent patterns, adapt them to our trading plan, and include seasonality along with our other strategies.
However, past performance does not guarantee future results, so again our advice is to just look at seasonality as one input among many.
By following these precautions, there is no need to bring in an additional risk management system than we usually use.
If you are ready to take advantage of seasonality and include it in your strategies, come join us at Real Trading.You can also safely experiment with your strategies in a simulated trading environment, without losing a penny, until you believe they are effective for the real market.


