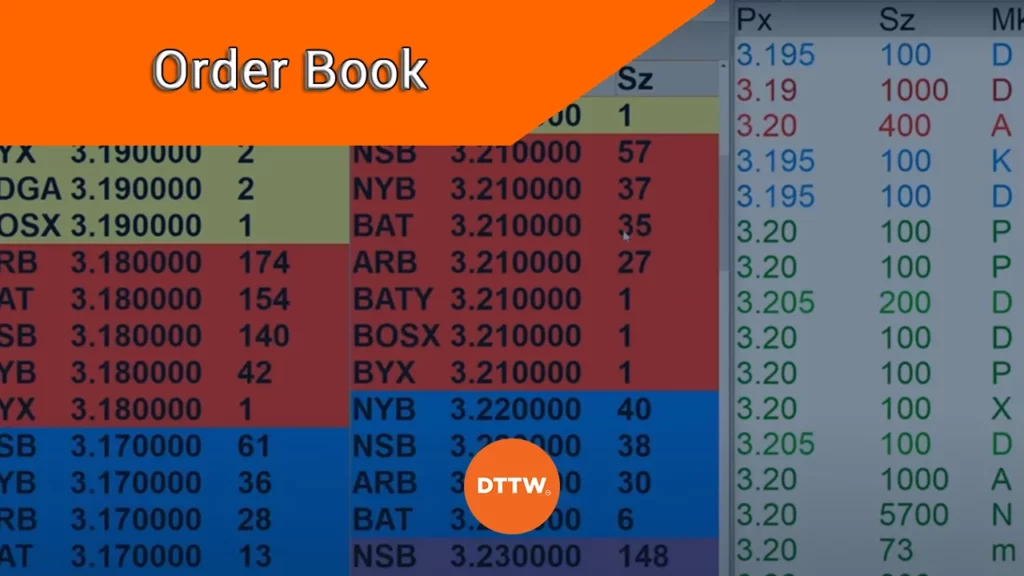
Order book is a popular and important tool that is provided by most online brokers especially in the stocks and cryptocurrencies industry. Experienced traders and investors use this data to make their decisions about a financial asset.
In this article, we will look at what an order book is and how you can use it successfully in the market.
Table of Contents
What is an order book?
An order book is a tool that provides more details about the orders that traders are placing in the market. It lists the volume of what they are buying and selling and their overall prices. Therefore, taking time to learn more about these trends will help you make better trading decisions in the market.
Another important benefit for using the order book is that it shows you the level of liquidity in the market. Ideally, by just looking at the flows of orders in a particular asset, you will be at a good position to understand how liquid or illiquid they are.
One of the most popular order book in the stock market is known as the NOII or the Net Order Imbalance Indicator. It is offered to many brokers in the US by Nasdaq TotalView. It is calculated automatically and continuously five minutes before the market opens and 10 minutes before it closes.
Also our Pro8™ has this feature, called Stock Window Tool.
OB Example
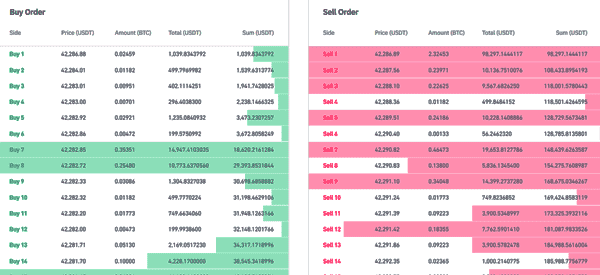
The chart below shows how an order book looks like. The order book showed in this chart is from Binance, which is the biggest cryptocurrency exchange in the world.
As you can see, the book has two sides: buy and sell order. In each of these sides, the order book lists the price, the amount the trader bought or sold, and the total amount.

How it’s composed an order book
The stock market is made up of millions of traders who execute trades every day. Therefore, as a trader, knowing how these participants are allocating their funds in a particular asset will help you make better decisions.
Therefore, if you can get more information about order movements, it will give you a better understanding about the market.
Level 2 Data
There are several key parts to an order book that is offered by most brokers. First, there is the level 2 data, which shows the bid and ask prices of a certain asset.
For most liquid stocks like Tesla and Apple, this data is usually updated in microseconds as the number of trades increase. That is why it is crucial to have access to this informations and make even more informed decisions.
Time and Sales
Second, there is time & sales tool that provides more details about the volume, price, direction, date, and time data for each trade. These numbers are provided in real time. Using the time and sales tool is known as reading the tape.
Order flow distribution
Third, some brokers provide a tool known as order flow distribution. It is typically a chart that shows inflows and outflows into a stock. The most important part of the distribution is that it shows you the constituents of the order flow.
Ideally, it shows the composition of orders by their sizes such as large, small, and medium.
Therefore, if you note that many large investors are buying a stock, it is an indication that they possibly know something that you don’t. As such, it makes sense to allocate some cash to the asset.
You can also look at the order flow distribution in general terms where you look at the total inflows and outflows. If there is more outflows than inflows, then it means that there could be some problems.
Large scale orders
The final part of order flow distribution is known as large scale orders in a certain period, typically 5 days. Again, this tool shows you the amount of large scale orders in that period and is a good thing for most traders.
How to read the order book
So, how do you read the order book in the market? The process is usually a bit easy especially when you are using newer trading platforms.
First, as you will find out, for most liquid stocks like Apple and Microsoft, reading the order book is not easy because of how fast the data moves.
» Related: Why market liquidity matter
Next, you need to understand the key terminologies in the order book. First, you will experience two terms known as bid and ask.
Ideally, a bid refers to the amount that a buyer is ready and willing to pay for an asset. Ask, on the other hand, is the maximum amount that a trader is ready and willing to buy an asset at. Most brokers give the buy side a green color and the sell side red color.
How to trade with the OB
Most traders use the order book as part of their research process. While you can find trade opportunities using these strategies, in our experience, the best approach is to combine them with other technical and fundamental analysis procedures.
When you find some unusual moves in the order book, fundamental analysis will give you more information on why it is happening. For example, it could be because a company published weak earnings or that a firm delivered some important news.
After finding these reasons, you can apply technical and price action analysis to find out more about the market.
In technical analysis, you will be using tool like moving averages and the Relative Strength Index (RSI) to determine whether to buy or sell an asset. In price action analysis, you will use the arrangement of a chart to determine whether it is a buy or sell.
Final thoughts
In this article, we have looked at what an order book is and the key components that make it including the level 2 and time and sales. We have also explained how to use the tool well in the financial market.
External Useful Resources
- What Is an Order Book? – The Balance


