Price action is a popular trading analysis strategy that complements technical and fundamental analysis methods. The difference between the two trading approaches is that it involves looking at charts and predicting what will happen in the future.
These strategies, basically, are not complicated to understand. However, there may be a few key steps that are a bit tricky, and it is always appreciated to have help in understanding them better.
In this article, we will look at some of the three secrets to use to understand price action.
Table of Contents
Types of price action patterns
There are two main types of price action patterns in the financial market. Since we have looked at them before, we will just mention them briefly here.
First, there are continuation patterns that signal that a chart pattern will continue in an upward or downward trend. Examples of these patterns are ascending and descending triangles, cup and handle, bullish and bearish flags and bullish and bearish pennants. When you identify one of these patterns, it means that the asset price will likely maintain the original trend.
Second, there are reversal patterns that signify that a price will likely start a trend in a new direction. Some of these patterns are rising and falling wedges, double and triple tops and bottoms, and head and shoulder patterns.
Another way to play reversal patterns is to use candlestick patterns. These are candlesticks that signal that a trend will either reverse or continue with the original direction.
Some of the most popular candlestick patterns are the hammer, bullish and bearish engulfing, morning star, three white soldiers, harami, shooting star, and piercing pattern among others.
With this in mind, let us look at some of the top secrets that will help you trade price action strategy well.
Declining momentum
Momentum is an important concept in price action strategy. It refers to the speed of change of the movement of a financial asset like a stock, commodity, or exchange-traded fund (ETF). A common use of the declining momentum concept is in FOMO trades.
As we described before, a Fear of Missing Out (FOMO) trade is where traders pile into an asset to ride the wave. As the price rises, it will reach a point where some of the earlier traders will start exiting their trades.
As they do this, the volume of the bullish asset will decline. As a result, this could be a good sign to start exiting your trade.
Example of FOMO trade
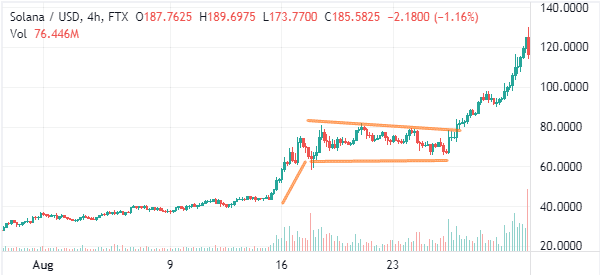
Let us look at a simple example. The chart below shows the price action of Solana, a popular cryptocurrency that has a market value of more than $30 billion. As you can see, the coin formed a bullish flag in August 2021. This flag is shown in black.
After that, the price broke out higher. As this FOMO trade rose, so did the bullish volume. However, we can see that the overall volume is starting to wane. Therefore, while this is not guaranteed, it means that the upward push will likely retreat in the near term.

Therefore, you should always look at the trends in volume when using the price action strategy. By so doing, you will be at a good position to determine whether the bullish trend will continue or whether a reversal is about to happen.
Identify false breakouts
We have looked at false breakouts before. Therefore, in this article, we will just briefly look at what it is and how you can use it to trade.
A breakout is a situation when the price of a financial asset moves substantially above or below a key level. For example, in the chart above, when the price managed to move above the upper side of the flag, that is known as a breakout.
Breakouts are so important that they form the background of price action trading. In other words, it is almost impossible to use the price action strategy without applying the concept of a breakout.
A false breakout happens when the price appears to move above a key resistance or below a key support and then moves in the opposite direction.
How to avoid them
There are three strategies to avoid these false breakouts. First, we recommend that you be patient before you place a trade during a breakout scenario.
As such, don’t just buy an asset because its price has moved above a key resistance level. In this case, you should wait and confirm that a bullish breakout has already happened. Generally speaking, there are a few things you should consider before placing a trade.
Second, you should use the concept of pending orders in this.
For example, you could place a buy stop trade above the resistance and a sell-stop trade below a support. As such, in case of a real breakout, these trades will be triggered.
Finally, there is the concept of a break and retest pattern when trading breakouts. This happens when a trade moves above a key level and then retests the support.
Consolidations
The next key secret when you are using the price action strategy is known as consolidations. A consolidation is a phase when a price is in a tight range. During this phase, it is often almost impossible to make money.
Besides, a stock will typically remain within a narrow range whose support is at say $10 and resistance is at $11.
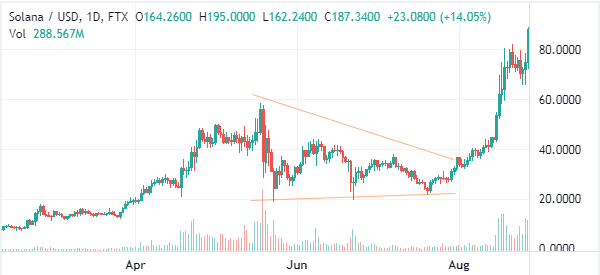
Therefore, in this case, you can only make money when a breakout happens. Besides, consolidations don’t last forever. They typically lead to a major bullish or bearish breakout. A good example of this is in the chart below.

As you can see, after a strong bullish rally, the price of Solana consolidated between May and July. Along the way, it formed a falling wedge pattern. Thereafter, it made a strong bullish breakout that pushed it to its all-time high.
Summary
Price action is a popular trading strategy in the financial market. When used well, the approach can easily show you where to buy or sell a financial asset. Therefore, in this article, we have looked at some of the key strategies to use when using the price action strategy.
External Useful Resources
- Is price action trading profitable? CMC Markets


