Volume is one of the most important concepts in the market. A sharper move that is not supported by higher volume tends to be a sign of a false breakout. Therefore, as the name suggests, the average price weighted by volume (VWAP) is the average price of a financial asset that is weighted by volume.
In other words, it is the dollar value of an asset’s period divided by the volume of the same period. The period is usually intraday and not several days.
Unlike other indicators like the Relative Strength Index and Stochastic, VWAP is not an indicator per se. It is a benchmark that is used together with other indicators. It is also commonly used by quantitative traders.
This indicator has been in use since 1984 when it was discovered by James Elkins, who was a trader at an investment firm known as Abel Noser, and it’s one of the most useful tool for entry and exit points.
Table of Contents
What is the VWAP?
The VWAP is a tool that is relatively popular among day traders. As the name suggests, the indicator primarily looks at the average price of an asset during a certain period and then finds its weighted volume.
The indicator typically tells traders the average price of an asset in a certain period. Therefore, it can be classified as a lagging indicator. The chart below shows the VWAP indicator added in the Polkadot chart.
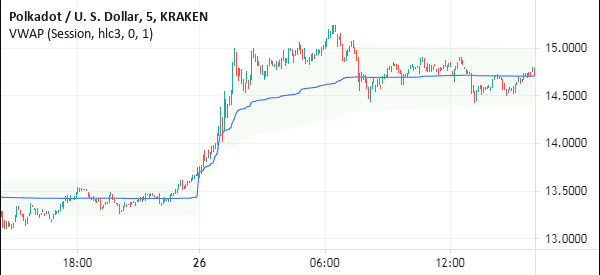
The other variation of the Polkadot indicator is one that has bands. When these bands are applied, the indicator has a closer relationship with Bollinger Bands, as shown below. The two lines surrounding the VWAP are basically the standard deviations of the indicator.
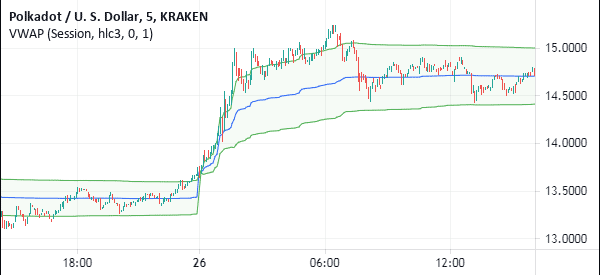
In short, if you place a buy order below the VWAP price, you have basically bought the asset at a discount. As you will find out, VWAP is not an effective indicator when using longer charts like daily or weekly.
Related » What is Anchored VWAP?
How do you calculate volume-weighted average price (VWAP)?
As with most indicators we have covered, knowing how to calculate the VWAP is not necessary. Instead, you should only be interested in applying the indicator and how to interpret it. There are several steps involved in calculating the volume-weighted average price.
First, you need to calculate the typical price for the intraday period. This is calculated by adding the high, low, and the close and then divide by three. The challenge for currencies is that it is difficult to calculate the close since they run for 24 hours Monday to Friday.
After calculating the typical price, you should multiply this number with the volume of the day.
The third step is to calculate a cumulative total of these prices. Finally, you should divide the running total price by the volume. A summary of this process is shown in the formula below.
| VWAP = (Typical price + volume) / cumulative volume |
In this equation, Pi and Qi are the price of the asset while Qi is the quantity.
How to Setup
Setting the VWAP is a relatively easy process since there are not many options to choose. First, you should select the source of the data. In this case, you should select whether you want to use the open, close, high, or HLC3.
Next, you should choose the anchor period. Here, you will select whether you want to use the current session, week, month, daily, or century. Next, you should select the standard deviation of the bands.
How to Trade with the VWAP indicator
The VWAP indicator is a lagging in nature just like the moving averages and the Parabolic SAR. This means that it uses historic data to predict the future performance of an asset. As a result, the more data you input into it, the more lag you will see.
In most charting software, the VWAP indicator gives six anchor periods:
- Session
- Week
- Month
- Year
- Decade
- Century
The most popular way to use the VWAP indicator is to combine it with other indicators. For example, in the chart below, we have applied the monthly VWAP indicator with the 20-day exponential moving averages.
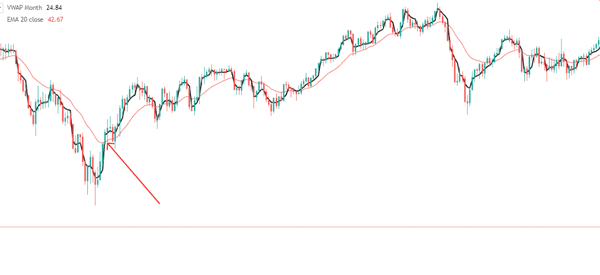
We use 20 because the market is usually open for 20 days in a month. As such, you can observe the points where the two indicators cross one another.
Video Explanation
For an even more complete explanation, you can watch the video published by our TraderTv partners.
We give you another help: the timing of the topics:
- 0:00 Introduction
- 0:19 Definition of Vwap and formulas
- 1:07 Explanation of Vwap with Facebook chart
- 5:31 Example – Facebook trade, Vwap as entry indicator.
Is VWAP Useful? Benefits of Using the Volume Weighted Average Price!
There are several key benefits of using the indicator. First, it is a relatively easy-to-use indicator unlike other complicated ones like the Ichimoku Kinko Hyo. All you have to do is to apply it in a chart and see the results.
Second, VWAP is easy to interpret. Most traders identify it as being bullish when the price is below the VWAP and bearish when it is above the price. The reason for this is that during an uptrend, there is more pressure to buy the price.
Third, it can be used to measure efficiency in the markets.
VWAP vs TWAP
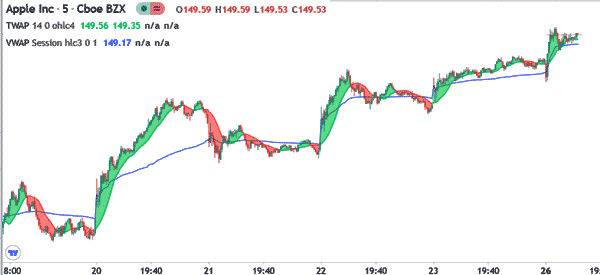
The VWAP indicator is often confused with the TWAP indicator. TWAP refers to the Time Weighted Average Price. The difference between the two is that TWAP does not take into consideration the number of shares, commodities, and ETFs traded in a given period.
The chart below shows the VWAP and TWAP applied on the Apple chart.
VWAP vs VWMA
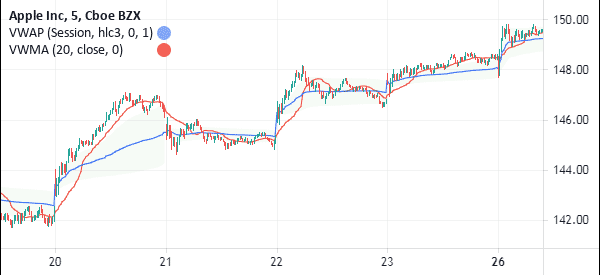
The VWAP is relatively different from the Volume Weighted Moving Average (VWMA). For one, VWMA is just a type of moving averages just as there are exponential MAs, smoothed MAs, and simple MAs.
The chart below shows the VWMA and VWAP applied on the same Apple chart as shown above.
Summary
The volume weighted average price is not a very common indicator in the market. In fact, very few traders know anything about it. Still, it is used by some of the most experienced intraday traders in Wall Street.
Also, since it is not installed as a default in most platforms, you must download and install it directly.
External Useful Resources
- What VWAP is and how to combine it with cluster analysis – ATAS


