

Volume is an important concept when trading the financial market. Indeed, we have written about it several times before in our volume, VWAP, and on-balance volume articles before. We have also recommended using volume indicators when using all types of technical indicators in the market.
In this report, we will look at the relative volume indicator, often shortened as RVOL, and explain how you can use it in the market.
Table of Contents
What is the Relative Volume Indicator?
Volume refers to the number of shares of a certain company that are bought or sold in any given day. Fortunately, this data is usually compiled and provided by most online brokers, which means that you can easily find it. For example, an average of more than 48 million Tesla shares are traded every day.
Therefore, if you find that 500 million shares have been traded, it can tell you something about the market.
The Relative Volume Indicator is, therefore, a tool that uses this data to illustrate the current volume of a stock compared to the past trading volume of the same stock. As such, this index is usually written as a ratio.
How the relative volume is calculated
The RVOL indicator is calculated in a relatively simple way. You just divide the current volume of an asset with the average volume in a certain period. Let us use the example of Tesla that is shown below.
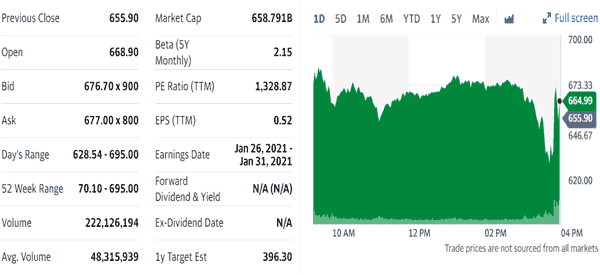
In the figure above, we see that on average, the volume of Tesla shares that are traded is about 48 million. At the time of writing (end of 2020), the volume had risen to more than 222 million because the company was being introduced to the S&P 500 index. As a result, the RVOL for the company is 4.65.
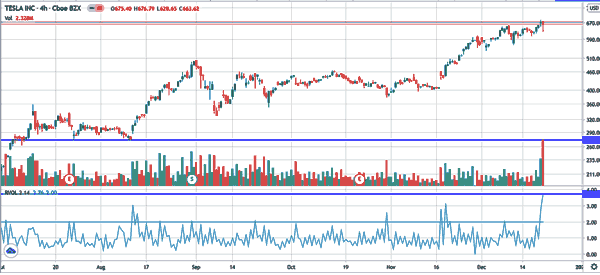
The chart below shows the four-hour chart of Tesla stock together with the volume indicator and RVOL.
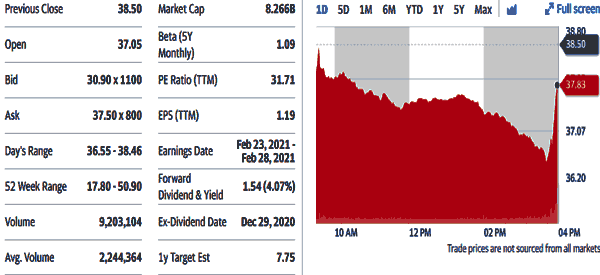
On the other hand, for a company like Nikola, the average volume is 22 million while the volume at the time of writing was 8 million. That brings the RVOL to 0.36.
It is worth noting that the RVOL is not found in most day trading platforms like the MetaTrader. It is also not inbuilt with the TradingView platform. Therefore, you must install it on the MT4/5 or use the non-built-in version in TradingView
How to Use the RVOL in trading
As a trader, you should always use the volume indicator when trading the market. The easiest approach to do this is to use the information provided in premarket trading.
For example, if you specialise on trading top movers, you should use information in premarket trading to find the top movers and their volume. For example, in the chart below, we see that Vereit is the best-performer in premarket trading as its stock has risen by more than 400%.
We also find that the average volume of the company is 2.4 million. But on this day, the volume was more than 9 million.
This means that the stock jump is being supported by volume. As such, you need to identify the reasons why the stock has risen that much.
By looking at the news of the day, we find that it rose that much because the company completed a 1 to 5 reverse split. This means that there was no major news that would affect the fundamentals of the company.
The worst-performer: Mesoblast example
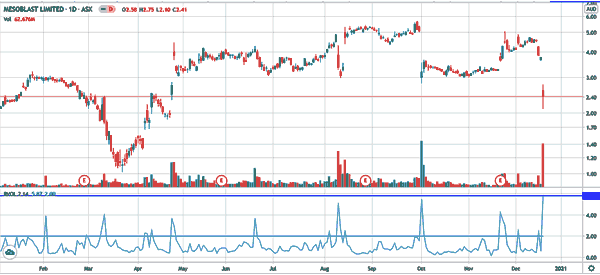
Let’s use another example. On the same day that Vereit stock jumped, we see that Mesoblast was the worst-performer in premarket trading. The average volume of Mesoblast is about 865,000 per day. On this day, the volume rose to more than 4 million.
Looking at the news, we see that this happened because a Covid-19 drug it was developing with backing by Novartis was not effective. That also pushed its Relative Volume relatively higher, as shown below.
Combining RVOL with other strategies
In most periods, using RVOL by itself tends to be meaningless. Therefore, we recommend a situation where you use other trading strategies to know whether to buy or short an asset.
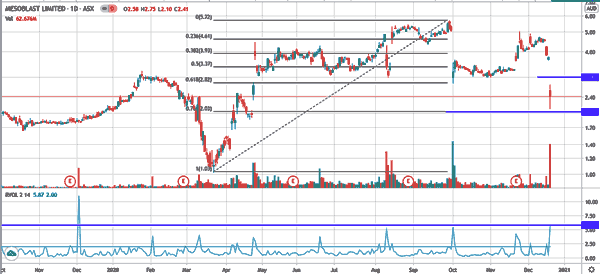
In the case of Mesoblast that is shown below, we can use the concepts of Fibonacci retracement. Below, we see that the stock crashed to near the 78.6% Fibonacci retracement level and then attempted to rebound.
Therefore, in the future, we know that there are two main scenarios.
First, the stock may attempt to fill this gap or it may attempt to fall below the retracement level. As such, we can place two pending orders that seek to benefit from either of the two. For example, you can place a sell stop order at $2 and a buy stop at $3.
If the stock drops below $2, your sell stop order will become a market order and push you to profitability. If it attempts to fill the gap, you will also be in the money.
Use it to confirm a trend
Another approach is to use the indicator to confirm a trend. In this case, if the RVOL indicator is higher than usual, it means that the trend is strong. It means that traders have increased their commitment to the price move, so it will continue its bullish trend.
On the other hand, if the price is rising while the RVOL is falling, it means that the trend is not all that strong.
Related » What Is Trend Trading?
Relative volume ratios
A good strategy to use when applying relative volume is to focus on ratios. This ratio is calculated by looking at the overall volume of shares traded in a certain period and then divide with a certain average volume.
For example, if the number of shares in a day is 110 million and the average volume in a 60-day period is 10 million, the ratio is 11. In most cases, you should look at stocks with a high relative volume ratio.
Final thoughts
The Relative Volume Index is an important concept that you should always use when trading in the financial market. The index can give you a good picture of what is happening in a given stock.
But using it alone is not worthwhile. Therefore, we recommend that you combine it with other financial tools.
External Useful Resource
- How To Calculate Relative Volume in Real TIme – StockBeep

